
The Important Role of Mapping Equatorial Guinea Regions in Petrochemical Industry
Location – The Key Ingredient in Region-Level Map Analysis
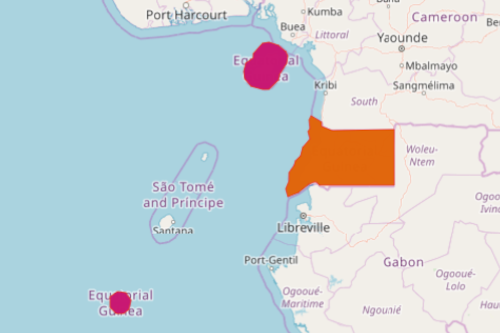
Mapping Equatorial Guinea regions plays an important role in the petrochemical sector. Nestled in the west coast of Central Africa, Equatorial Guinea is one of the continent’s richest countries. It prides in having high potential gas reserves. In fact, it is one of the largest oil producers in Africa. In line with this, the country also shows much potential in the petrochemical sector. Defining the regions by overlaying the boundaries on a map therefore is instrumental to government agencies and private sectors as they develop oil and gas asset potentials. Areas that show potentials in the industry can be immediately spotted. On the other hand, areas that are promising but are yet untapped are clearly showcased.
With powerful mapping tools, Mapline provides more than location-based data. It provides patterns and relationships of locations with each other. With an overlay of regional boundaries, geographical connections are identified that evoke the thought process suitable for decision-making.
Map to Identify Emerging Trends in Petrochemical Industry
In a maze of challenges in the petrochemical industry, an Equatorial Guinea region map is the key to unlock these challenges. So start creating a map now!
- Create a Mapline account and login.
- Click the orange “Add New Items” button.
- Select “New Map” on the drop down arrow.
- Give your map a name and click “OK.”
- Click the “Add” button from the left sidebar.
- Select the “Territories” option.
- Click “From Mapline’s Repository.”
- From the “Territories” select “Equatorial Guinea Regions.” Use the search bar for quicker results.
- Select how you want your boundaries to be colored in “Fill Color” (Random Colors, Uniform Color, Dynamic heat map colors, or Custom colors from spreadsheet).
- Click “OK.”
Mapping the regions of Equatorial Guinea is truly a vital analytic tool to help you with petrochemical asset management. Sign up now and start using other powerful mapping tools. Boost your decision making and map along basic selection of locations to understand the influence of locations in your market.