
Wow Your Audience as You Present Myanmar Map of Townships
How to Make Your Presentations More Engaging
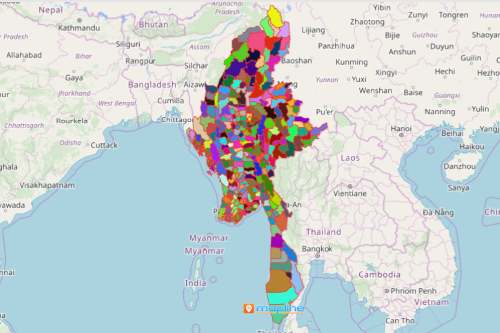
The best way to present Myanmar map of Townships. Being the largest country in Southeast Asia, Myanmar displays one of the fastest growing economies in the world. Industries such as business, mining, agriculture, tourism, and oil and gas, look all promising. Myanmar is divided into 324 townships. A closer look at township boundaries gives you a full idea why localization is important. In Mapline, we help your audience visualize your data by creating powerful reports that are engaging. Mapline’s BI Basics provides step-by-step guides and videos to help you get started with your presentation. Create a dashboard as your single source of information where you can customize charts and generate in-depth reports.
Use Mapline’s Dynamic BI Charting to its full potential when doing presentations. Here, you can create a donut/pie chart or a vertical bar chart. You can also create and filter a report. Territory reporting is something that you want to jump right in to know more about the strengths and opportunities posed on each territory. Graphs, charts, and reports are carefully designed so that sharing and embedding them on a website can be done easily. No doubt you will wow your audience by your presentation because the charts and reports are not only attractive to see. More than that, a Myanmar township map provides insights, not only territory boundaries. Indeed, it makes more sense!
Cut The Boring Stuff!
Cut the boring stuff as you present a township map of Myanmar. Follow these 10-step guides carefully and you’re on your way to make a powerful presentation. Then share your report to your teammates.
- Create a Mapline account and login.
- Click the orange “Add New Items” button.
- Select “New Map” on the drop down arrow.
- Give your map a name and click “OK.”
- Click the “Add” button from the left sidebar.
- Select the “Territories” option.
- Click “From Mapline’s Repository.”
- From the “Territories” select “Myanmar Townships.” Use the search bar for quicker results.
- Select how you want your boundaries to be colored in “Fill Color” (Random Colors, Uniform Color, or Custom colors from spreadsheet).
- Click “OK.”
Maximize your use of the Myanmar map of townships. Sign up now and get started with customizing your own dashboard with charts and reports that move your audience into action.