
Monitor Economic Growth by Mapping US Consolidated Cities
Discover More as You Overlay Consolidated City Boundaries on Your Map
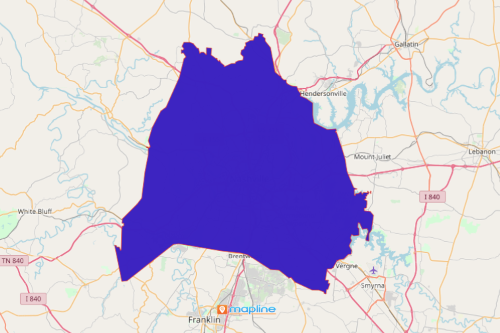
A growing number of organizations in the private sector are mapping US consolidated cities. In the US, a consolidated government is considered to be a local government unit where an incorporated place and its county or minor civil division functions have merged. A map with an overlay of consolidated city boundaries is used to understand the strengths and opportunities of each consolidated city. Furthermore, it helps to analyze and visualize economic growth potentials. By combining location data and territory boundaries, data analysis will reveal patterns and data connections integral to understanding community growth potentials. Mapline’s available consolidated city boundaries are available to use in mapping in the states of Connecticut, Georgia, Indiana, Kansas, Kentucky, Montana, and Tennessee.
There are a lot more things that you can do as you generate your map of consolidated cities. Use the territory analysis tool for further analysis. You can even customize your territories to fit your analysis.
Start Mapping Consolidated Cities Now!
How? Easy! Just follow these simple steps:
- Create a Mapline account and login.
- Click the orange “Add New Items” button.
- Select “New Map” on the drop down arrow.
- Give your map a name and click “OK.”
- Click the “Add” button from the left sidebar.
- Select the “Territories” option.
- Click “From Mapline’s Repository.”
- From the “Territories” select “U.S. Consolidated Cities.” You can also enter that on the search bar.
- Select how you want your boundaries to be colored in “Fill Color” (Random Colors, Uniform Color, Dynamic heat map colors, or Custom colors from spreadsheet).
- Click “OK.”
Sign up now and discover new ways to incorporate mapping tools to your data analysis as you monitor economic growth.