
Meso Regions of Brazil Map to Monitor Business Continuity
How Meso Region-Level Mapping Helps to Drive Timely Business Decisions
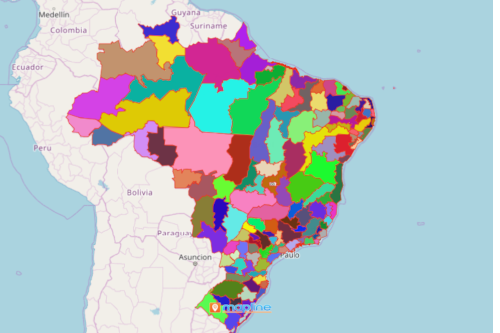
A meso regions of Brazil map is a reliable tool for local government to maintain business continuity amidst the pandemic. Brazil has a unique administrative level called “Meso Regions.” These regions are used to group the municipalities of Brazil with common characteristics. At the same time, it is also used to group municipalities in terms of their proximity to each other. There are 136 meso regions in Brazil. Mapline has this kind of territory boundary in store for you. When mapping your Excel spreadsheet with an overlay of Brazil meso regions, you can easily see patterns and relationships. Additionally, it helps to discern how the location data affects the meso region boundaries.
A map showing the meso region boundary of Brazil is an effective guide for both business sectors and government agencies to face challenges brought about by COVID-19. Hence, we can say that maps with location data can drive timely decisions to be more prepared during the pandemic.
Benefits of Powerful Mapping in Decision-Making
Mapline has a wide range of powerful mapping tools to help in communicating, monitoring, and helping the community to keep moving forward. The first step is to start mapping! Here are the easy steps to follow to create a map of Brazil meso regions:
- Create a Mapline account and login.
- Click the orange “Add New Items” button.
- Select “New Map” on the drop down arrow.
- Give your map a name and click “OK.”
- Click the “Add” button from the left sidebar.
- Select the “Territories” option.
- Click “From Mapline’s Repository.”
- From the “Territories” select “Brazil Meso Regions.” You can also enter that on the search bar.
- Select how you want your boundaries to be colored in “Fill Color” (Random Colors, Uniform Color, Dynamic heat map colors, or Custom colors from spreadsheet).
- Click “OK.”
Be prepared more than ever as this health crisis evolves. Sign up now to learn more on how Mapline can empower your organization with actionable insights through mapping.