Close
WE'RE ALL ABOUT
YOUR
SUCCESS
HOW WOULD YOU LIKE TO GET IN TOUCH:
Email
Calendar
Close
READY FOR MAPLINE TO
ROCK
YOUR WORLD?
Our team is ready to help you eliminate wasted time, maximize your sales coverage, and supercharge your team's efficiency. We'll provide the expert guidance and tailored solutions you need to get things right.
Stop missing out on valuable opportunities. Reach out, and we'll get started on optimizing your territories today!
Email
Calendar
Close
READY FOR MAPLINE TO
ROCK
YOUR WORLD?
WE WANT YOU TO EXPERIENCE EVERY-THING YOU'VE BEEN MISSING BY STARTING YOUR FREE TRIAL TODAY! OUR TEAM IS READY TO HELP CHANGE YOUR LIFE. SO REACH OUT AND WE'LL GET THINGS STARTED!
Email
Calendar
Close
READY FOR MAPLINE TO
ROCK
YOUR WORLD?
Discover the potential of Mapline with a LIVE DEMO from our experts. This is your chance to see it in real-time and get all your questions answered. Connect with us to schedule your demo today!
Email
Calendar
Close
Give us a call. We'd love to talk!

+1 800.969.1454

Close
Give us a call. We'd love to talk!

+1.888.670.3795

Close
Close
Geo Mapping Starter Close

Experience the power

Get ready to see your data in a whole new way!
Geo BI Trial Close

Experience the power

Get ready to see your data in a whole new way!
Your 7-day free trial awaits!
Geo Routing Trial Close

Experience the power

Get ready to see your data in a whole new way!
Your 7-day free trial awaits!
Geo Scheduling Trial Close

Experience the power

Get ready to see your data in a whole new way!
Your 7-day free trial awaits!
Close
Close
5 Data Visualization
Mistakes
That Could Cost You Clients
5 Data Visualization
Mistakes
That Could Cost You Clients
  • Blog
  • Geo BI
  • 5 Data Visualization Mistakes That Could Cost You Clients

In today’s competitive environment, data visualization is one of the most powerful ways businesses communicate value. Whether it’s through a business intelligence dashboard, a client-facing report, or an internal presentation, visuals transform raw data into insights. But when done poorly, data visualization can backfire. Misleading graphs, cluttered dashboards, or confusing charts don’t just obscure insights—they can damage credibility, erode trust, and even cost you clients.

The good news is that most visualization mistakes are avoidable. By focusing on best practices and choosing the right tools, businesses can ensure their visual storytelling reinforces trust, delivers clarity, and drives smarter decision-making.

Data visualization mistakes can cost you clients
magnifying glass with a checkmark inside

Pro Tip: Avoid the trap of “visuals for visuals’ sake.” The best data visualizations are simple, targeted, and actionable. With Mapline’s Geo BI and visualization features, you can transform spreadsheets into clear stories that impress clients and guide smarter decisions.

Mistake 1: Overloading Dashboards with Too Much Data

One of the most common mistakes in data visualization is information overload. Business intelligence dashboards packed with every possible chart or metric may feel comprehensive, but in reality, they overwhelm the audience. Instead of clarity, stakeholders see clutter. This makes it harder to identify what’s truly important, leading to confusion or inaction.

Effective dashboards should highlight a few key metrics aligned with business goals. For example, a sales dashboard might focus on regional performance, pipeline velocity, and top accounts—leaving out less relevant details. Platforms like Tableau business intelligence software make it easy to create complex dashboards, but without discipline, complexity can take over. Mapline helps businesses avoid this pitfall by offering streamlined BI visualization tools designed to prioritize clarity and simplicity.

Mistake 2: Using the Wrong Chart for the Message

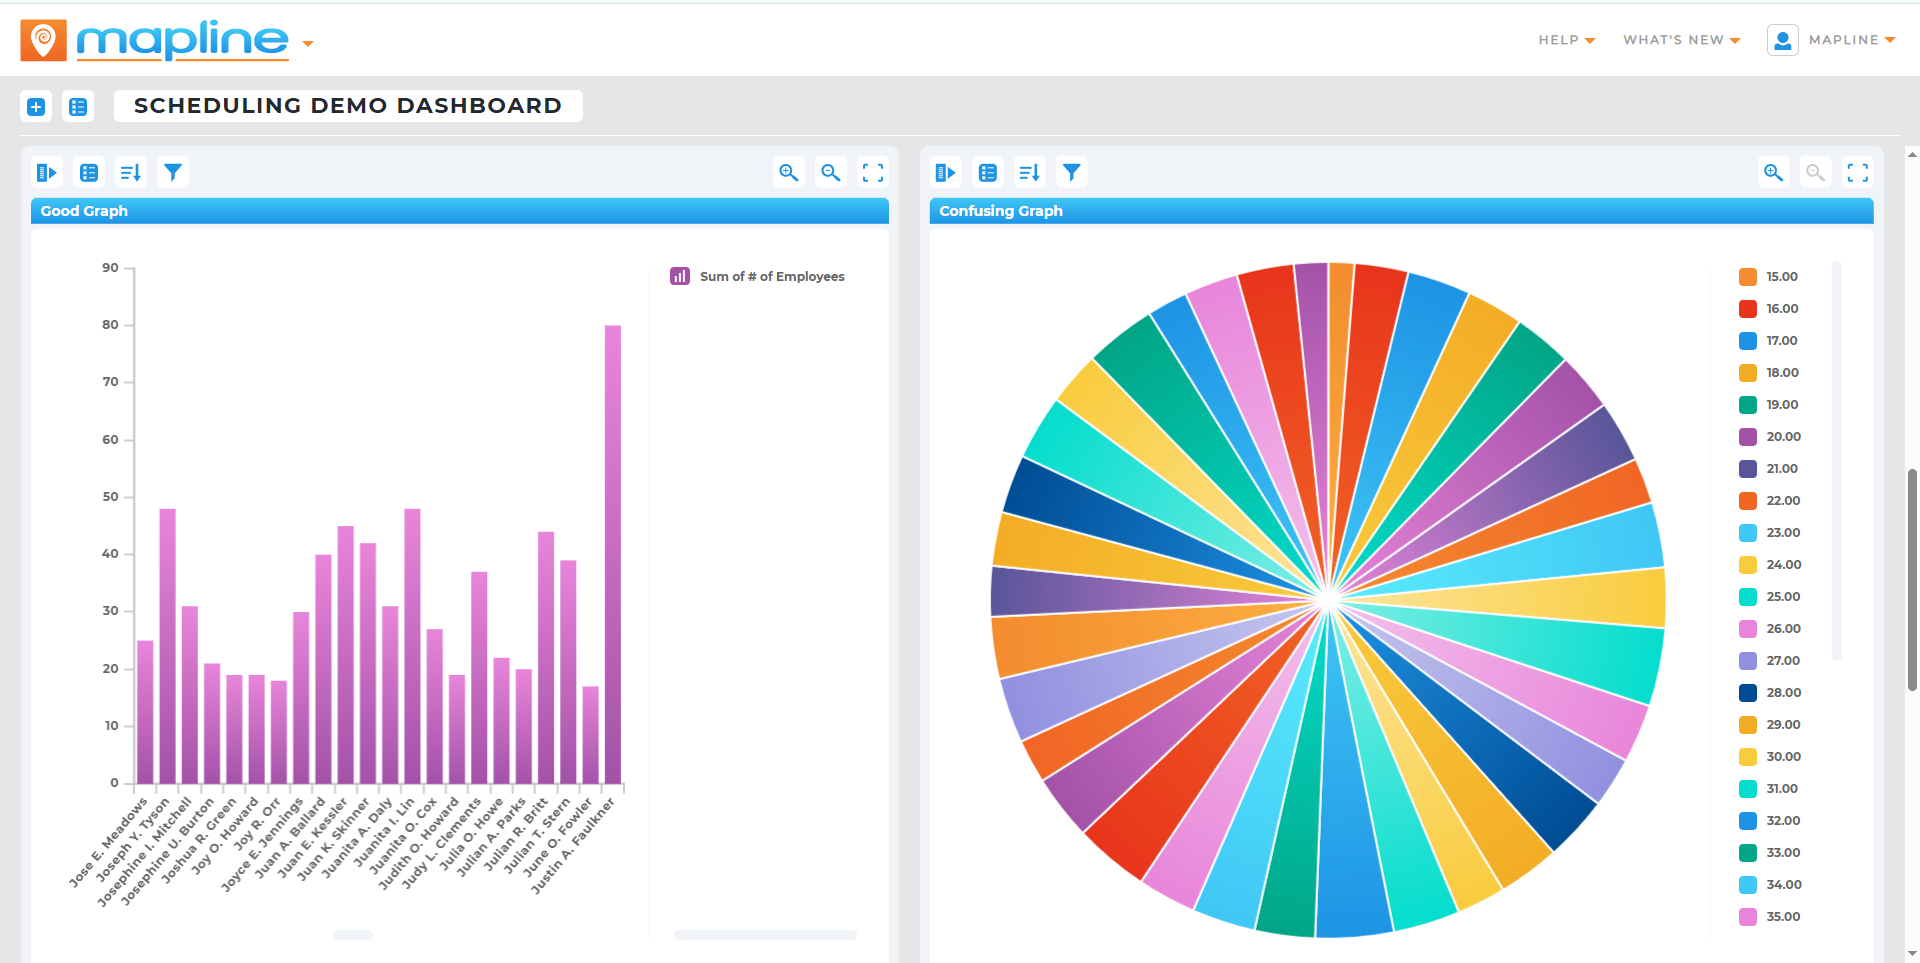
Not all charts communicate data equally. A line chart may be perfect for showing trends over time, but disastrous for comparing categories. Similarly, pie charts are notoriously overused, often creating misleading data visualization when too many slices compete for attention. Choosing the wrong visualization risks confusing your audience or, worse, presenting an inaccurate picture of performance.

To avoid this, match the chart type to the story. Use bar charts for comparisons, heat maps for density, and scatter plots for correlations. While business analytics platforms like Power BI data visualization modules offer dozens of chart types, simplicity often wins. Mapline emphasizes intuitive visualizations—helping teams select the right format automatically so insights remain accurate and impactful.

Mistake 3: Ignoring Context and Scale

Another frequent error is presenting data without context. For example, showing revenue growth in isolation may look impressive, but without regional comparisons or year-over-year benchmarks, the insight loses meaning. Similarly, manipulating scales on charts can exaggerate or minimize trends, creating misleading impressions that damage credibility.

Clients expect transparency. Misleading data visualization examples are often cited as reasons for mistrust in reports. By ensuring consistent scales, clear labeling, and relevant benchmarks, businesses can present data with integrity. This is where Mapline’s platform shines—combining geographic overlays, demographic insights, and customizable filters to provide context that turns numbers into actionable narratives.

Mistake 4: Overlooking Design and Accessibility

Design matters in storytelling with data. Cluttered labels, inconsistent color schemes, or inaccessible layouts make visuals harder to understand. For clients, bad data visualization examples—such as unreadable dashboards—signal a lack of professionalism. Worse, they risk excluding audiences who may not have technical backgrounds or accessibility tools.

Best practice is to keep designs clean, consistent, and color-conscious. Use contrast to highlight trends, avoid unnecessary 3D effects, and ensure dashboards are readable across devices. Unlike many BI visualization tools that require manual customization, Mapline delivers design-ready outputs, allowing businesses to focus on insights rather than formatting.

Mistake 5: Failing to Connect Visuals to Action

The ultimate purpose of visualization isn’t to display data—it’s to drive action. Too often, reports end with charts but no clear takeaway. Clients may walk away with more questions than answers, eroding confidence in your expertise. This is the costliest mistake of all, because it undermines the entire point of data visualization for business.

Every chart, dashboard, or visualization should answer a question or guide a decision. For example, a client dashboard might not only show declining engagement but also highlight the regions or segments where it’s happening. By connecting data directly to strategy, businesses ensure visualizations strengthen relationships and demonstrate value. Mapline helps teams close this loop with intuitive storytelling features that tie visuals to insights and insights to action.

Good vs. Bad Data Visualization Examples

Sometimes the easiest way to understand best practices is to see what to avoid. These side-by-side comparisons highlight how small adjustments in design and intent can transform a confusing chart into a clear story that builds client trust.

Pie Charts vs. Bar Charts

A pie chart with 12 slices, all similar in size, is one of the most common bad data visualization examples. The more categories you add, the harder it becomes for the viewer to distinguish meaningful differences. By contrast, a simple bar chart comparing the same categories presents those differences immediately and without confusion. Bar charts are more intuitive for comparisons and allow the eye to pick up patterns quickly. The result is a clearer story and a stronger impact.

Overloaded Dashboards vs. Focused KPIs

Dashboards crammed with every possible chart or metric may seem comprehensive, but they overwhelm users and bury the insights that matter most. Scrolling endlessly to find the right number frustrates stakeholders and slows decision-making. A better approach is to highlight just three to five core KPIs directly tied to business goals. A business intelligence dashboard that stays lean and intentional gives clients confidence that you understand their priorities. Focused dashboards drive faster, more decisive action.

Manipulated Scales vs. Transparent Context

Line charts with manipulated y-axis scales can exaggerate or minimize small differences, creating misleading data visualizations. This damages trust and can make clients question your credibility. Properly scaled charts, paired with benchmarks or year-over-year comparisons, provide the transparency needed to interpret trends accurately. Context transforms raw numbers into meaningful insights, ensuring stakeholders understand not just what changed, but why. The integrity of your visualizations becomes a foundation for stronger business relationships.

Complex Palettes vs. Clean Design

Using inconsistent or overly complex color palettes distracts from the story the data is trying to tell. When every chart element fights for attention, the message gets lost. Clean design with consistent, high-contrast colors helps guide the viewer’s eye directly to what matters most. A clear, thoughtful design improves readability across audiences—including those less familiar with technical dashboards. Better design equals better communication.

Raw Numbers vs. Story-Driven Narratives

Presenting raw numbers or visuals without context leaves clients wondering how to interpret the information. This not only reduces the value of your work but risks undermining the relationship altogether. The stronger approach is to frame visuals within a narrative that explains the “what,” “why,” and “what next.” Connecting data to decisions transforms charts into stories that inspire action. When every visualization ends with clarity and direction, clients gain trust in both the data and your expertise.

What is a common example of bad data visualization?

A cluttered pie chart with too many categories is one of the most cited examples of bad data visualization, since it obscures insight instead of clarifying it.

Why can misleading data visualization cost clients?

If clients perceive visuals as inaccurate or manipulative, it damages trust. Credibility is essential for long-term client relationships.

How do BI tools improve data visualization?

Business intelligence tools like Mapline, Power BI, or Tableau allow businesses to build interactive dashboards that simplify complexity. Mapline differentiates by focusing on ease-of-use and clarity.

What are best practices for data visualization in business?

Keep visuals simple, select the right chart for the data, maintain context, design for clarity, and always connect insights to action.

Can small businesses benefit from data visualization software?

Yes. Small businesses often gain the most value from data visualization since it helps them compete by making smarter, faster decisions with limited resources.

STOP LOSING CLIENTS TO CONFUSING REPORTS. VISUALIZE DATA CLEARLY NOW