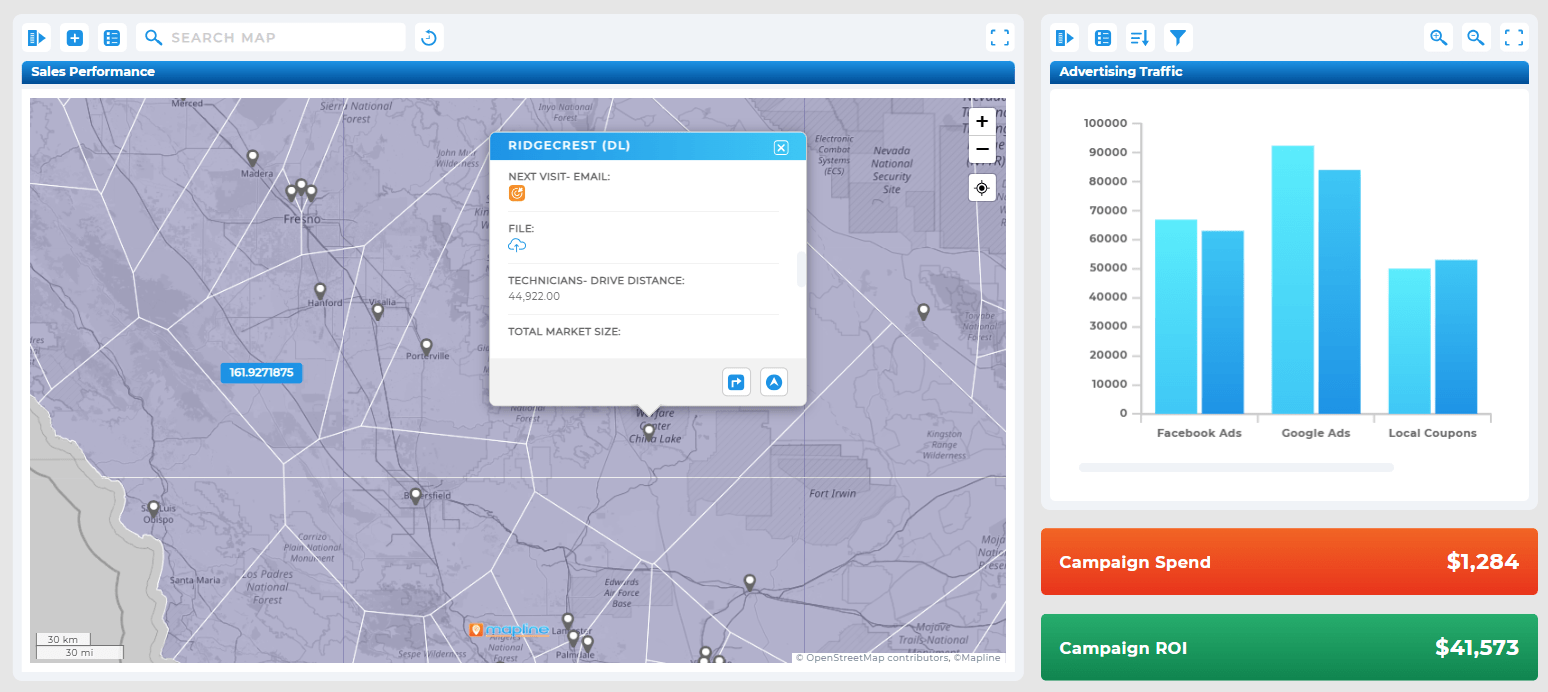
Today’s business world moves fast—and your data tools need to keep up. That’s where ad hoc analysis comes in. Unlike static reports or scheduled dashboards, ad hoc reporting gives your team real-time access to the answers they need, exactly when they need them. It empowers decision-makers across departments to explore live data, filter by key criteria, and get insights on the fly. When everyone can ask better questions and find answers independently, business decisions get faster—and a whole lot smarter.
Here are five ways ad hoc analysis unlocks better collaboration and performance across departments.
What is Ad Hoc Analysis?
Ad hoc analysis is a form of data exploration that allows users to answer specific business questions on the fly. Instead of relying on pre-built dashboards or scheduled reports, ad hoc reporting enables real-time, custom queries tailored to the task at hand. This flexible approach helps teams respond quickly to changes, test hypotheses, and drill into root causes with speed and precision. It’s especially valuable in fast-paced environments where agility and insight are critical. With ad hoc reporting tools, non-technical users can filter, visualize, and analyze data without needing to submit requests to IT or data analysts.


Pro Tip: Looking for real-time ad hoc analytics without the learning curve? Geo Mapping makes it easy for any team to explore data visually, build custom dashboards, and uncover instant insights without writing a single query.
1. Encourages Real-Time, Data-Driven Decisions
Ad hoc analysis empowers teams to move beyond static reports and act on live insights. Instead of waiting for scheduled dashboards or quarterly reviews, decision-makers can ask questions in the moment and get immediate answers. This agility means marketing can adjust campaigns mid-flight, sales can shift focus to high-performing territories, and operations can resolve bottlenecks before they escalate. With access to fresh, visual data, teams no longer rely on assumptions or gut instinct—they respond to what’s happening right now. The result is faster, smarter, and more confident decision-making across the organization.
2. Supports Self-Service BI Across Departments
With self-service business intelligence tools, teams don’t need to rely on analysts or IT to get the insights they need. Marketing can drill into campaign performance. Sales can pull pipeline reports. Operations can analyze fulfillment bottlenecks. Ad hoc reporting software democratizes data and gives every user the power to explore it. This independence reduces bottlenecks and fosters a data-first culture across your company. Tools like Tableau, Power BI, and Mapline are leading the charge in this self-serve movement.
3. Enables Customized, Role-Specific Reporting
Not every department needs the same data—or wants to see it in the same way. With ad hoc reporting tools, users can tailor dashboards and filters to reflect the metrics that matter most to them. Sales reps may track quota progress while service managers examine case resolution rates. The flexibility of ad hoc analysis ensures insights are both relevant and actionable. Best of all, it prevents data overload by keeping each view focused and intuitive.
4. Drives Cross-Functional Alignment with Shared Insights
Ad hoc analysis doesn’t just help individual teams—it brings them together. By using shared dashboards or exportable reports, teams across sales, marketing, operations, and finance can align around the same KPIs. These insights become a common language, helping teams set unified goals, assess impact, and solve problems together. This visibility enhances transparency, reduces miscommunication, and supports more informed decision-making across departments.
5. Speeds Up Root Cause Analysis and Strategic Planning
When a problem arises, you don’t want to wait days for a report to diagnose the issue. With on-demand data analysis, teams can dig into the numbers immediately. Drill-down analysis lets users trace a trend to its source—whether it’s regional performance drops, customer churn, or inventory gaps. This speed makes it easier to solve problems and spot opportunities before competitors do. Over time, it improves forecasting and strategic planning, turning reactive teams into proactive ones.
Ad hoc analytics is the process of creating custom, on-demand reports or dashboards to answer specific business questions. It’s different from standard reporting because it isn’t scheduled or templated—it’s tailored in real time.
Traditional reporting is often scheduled, automated, and consistent. Ad hoc analysis is more flexible—it allows users to explore data on the fly, apply filters, and dig into insights for time-sensitive or one-off questions.
Everyone from sales managers to marketers, finance teams, and executives can benefit. Ad hoc reporting empowers users to explore data independently without relying on IT or data teams.
Top tools include Mapline, Tableau, Power BI, Looker, and Domo. The best option depends on your data complexity, team size, and need for visual vs. tabular insights.
Self-service BI tools allow every department to explore, visualize, and report on their own data. This autonomy speeds up decision-making and enhances collaboration across business units.


