Quick Reference Guide
Change Data Source
- Quick Reference Guide
- Change Data Source
Change the dataset your visualization is based on! This is a shortcut to enable you to preserve the location of your chart or report on a dashboard. Once you change the data source, the entire chart or report will be wiped and you will have to reconfigure everything.

Pro Tip: There is no Undo button for changes made to your data source. It’s best to duplicate your chart, report, or view before changing the data source. This way, you can always revert back to the original if needed.
CHANGE DATA SOURCE
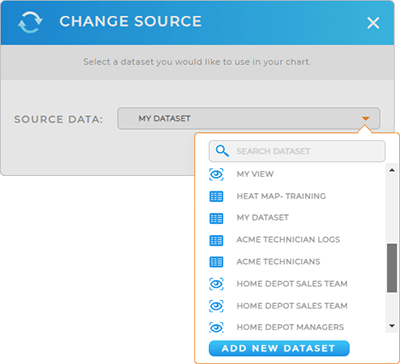
Click the drop-down menu to select your desired dataset.
Alternatively, click the blue Add New Dataset button at the bottom of the drop-down menu to create a completely new dataset for this visualization.
If you have visualizations that depend on specific column headers, you’ll want to ensure that the new source dataset includes the same column headers.
If the new dataset is significantly different from the original, you may need to re-format your visualization to get the information you want.

REVERSE DATA SOURCE
If you decide you want to go back to the original data source, just click the Options menu and select Change Source again. Select the original dataset from the drop-down menu and your visualizations will revert back to the previous display.


