Summer is here, and we’re heating things up with a sizzling array of updates to take your mapping experience to the next level. Get ready to dive into a pool of exciting new features designed to supercharge your workflows and unlock fresh insights.
Whether you’re planning routes for summer deliveries, optimizing sales territories for peak season, or analyzing marketing data for your next campaign, our June updates will make things run smoother than ever. So grab your sunglasses and a cold drink, because it’s time to soak up the sun and explore the hottest updates in town!
MAP ENHANCEMENTS
Revolutionize the way you interact with your maps. Personalize the data you see, edit territories with ease, and navigate with vehicle-specific routes. These updates are designed to give you more control and precision in your mapping tasks, making your work more efficient and effective.
Vehicle-Specific Navigation
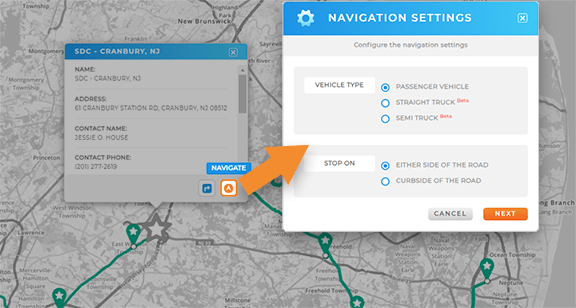
Select your desired vehicle type in navigation to customize routes for your specific vehicle. Avoid restricted routes and get accurate directions and travel times, every time.
Choose from the following vehicle types to ensure timely arrival and efficient use of resources:
- Passenger vehicle: Standard cars for everyday transportation
- Straight truck: Medium-sized trucks for local deliveries
- Semi truck: Large tractor-trailers for long-haul freight transport
Additionally, determine whether you want to optimize your navigation for curbside routing. Drive smarter with routes custom-tailored to your business!
Slice, Cut, & Drag Territories
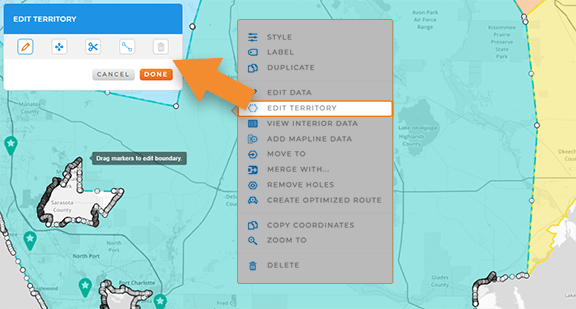
Edit territories and shapes with the click of a mouse! Drag, cut, slice, or refine your map areas quickly and efficiently, making territory management more intuitive and precise. This powerful feature allows brands to respond dynamically to changes in their business environment, ensuring that territories are always optimized for performance and resource allocation.
For example, a logistics manager can easily adjust delivery zones based on changing demand patterns, ensuring that resources are allocated efficiently and customer deliveries are timely. Gain the edge in territory management with these seamless editing tools!
Customized Pop-out Bubbles
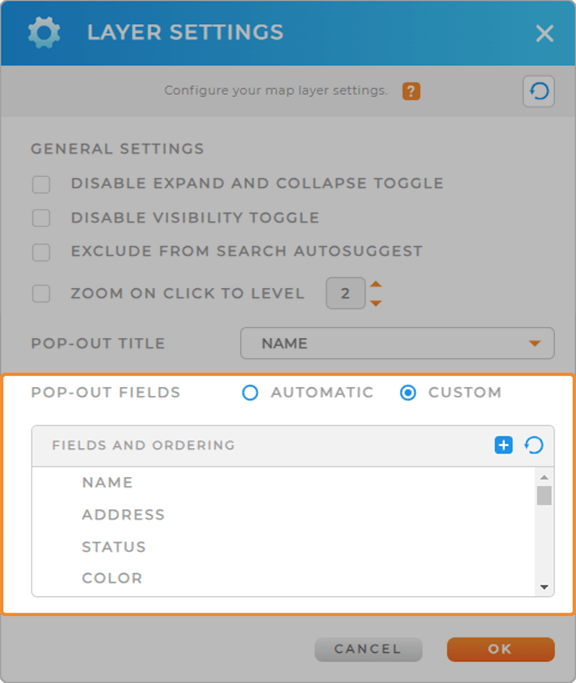
You can now automate or customize your pop-out field settings, giving you complete control over the information displayed in your map bubbles.
This customization enhances the relevance and efficiency of your data visualization, making it easier for your team to access critical information quickly.
For example, a sales manager can customize pop-out fields to display the latest sales figures and customer contact information, allowing sales reps to quickly see their performance metrics and customer details without leaving the map.
Make your data work for you, just the way you need it!
DATASET UPGRADES
Download multiple files from a file column in one go, making it easier to access attached documents directly from your dataset. Improve data handling and keep relevant documents readily available.
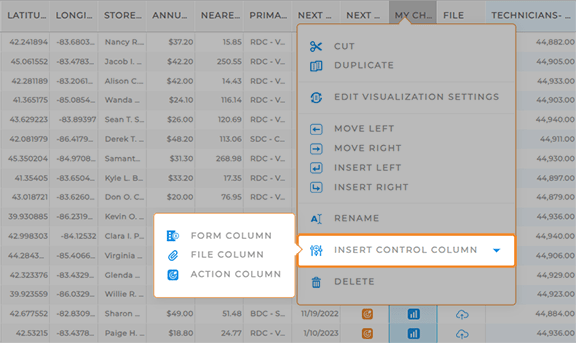
Or, right-click to insert control columns and paste cut columns effortlessly. This feature allows you to add or cut columns with ease, giving you more flexibility in managing your datasets. Simplify your data management tasks and keep your team moving forward!
These upgrades are designed to give you more control and flexibility in managing your datasets, making your data work harder for you and your team.
VERSATILE ROUTING OPTIONS
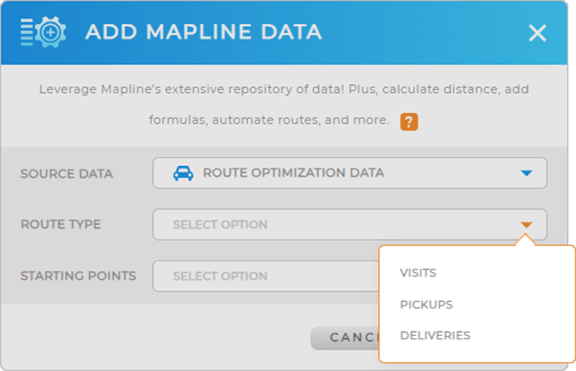
Plan your routes for visits, pickups, or deliveries, tailoring your route planning to your specific needs. Optimize your routes for different types of trips and improve overall efficiency.
For example, a courier service can create optimized routes for drivers based on whether a client needs pickup or delivery, ensuring timely and efficient services. Or, a sales manager can route for visits, since their team members need to visit clients at each location.
These versatile options are all about making sure your routes are as efficient and effective as possible, no matter what kind of trips you need to plan. Now, that’s what we call top-of-the-line route automation!
REPORT CUSTOMIZATIONS
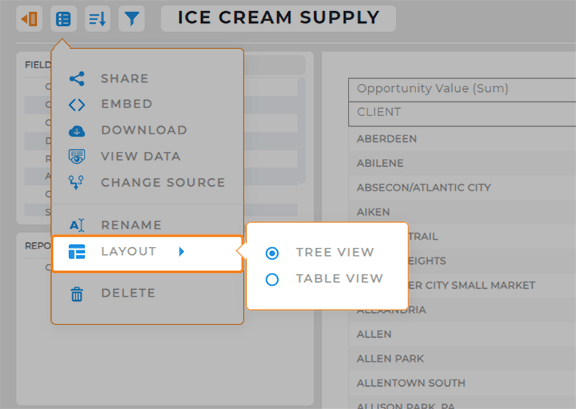
Customize your reports to fit your analytical needs. There are two different ways to visualize your data in a report:
- Tree view: Provides a hierarchical display of data
- Table view: Offers a more traditional, grid-like format
Plus, the new SHOW TOTAL option allows you to quickly see the sum of values, providing immediate insights into your data’s overall metrics. Gain a clearer picture of your data and make informed decisions faster!
