Business Intelligence tools have changed the way teams operate. Gone are the days of static spreadsheets and quarterly reports. Today’s most successful teams run on real-time data—and the right business intelligence tools make that data actionable. Whether you’re optimizing operations, tracking sales performance, or launching a new campaign, modern BI software helps you spot patterns, uncover insights, and pivot with confidence.
But not all BI platforms are created equal. The best ones go beyond dashboards, offering interactivity, location intelligence, and cross-functional analytics that support every department—not just the data team. Mapline brings all of that and more. It’s not just a reporting tool—it’s a complete intelligence platform designed to fuel fast, strategic decision-making at every level of your organization.
What Are Business Intelligence Tools?
Business intelligence tools help organizations collect, analyze, and visualize data to make better business decisions. These tools aggregate raw data from across departments and turn it into reports, dashboards, and interactive visuals that highlight what’s working—and what isn’t.
Traditional BI tools focused on static reports. But today’s BI dashboard software is built for real-time insights. With interactive maps, live data feeds, and automated updates, you don’t just report on the past—you respond to what’s happening right now. Whether you’re analyzing performance, tracking KPIs, or forecasting outcomes, the right business data tools keep you ahead of the curve.
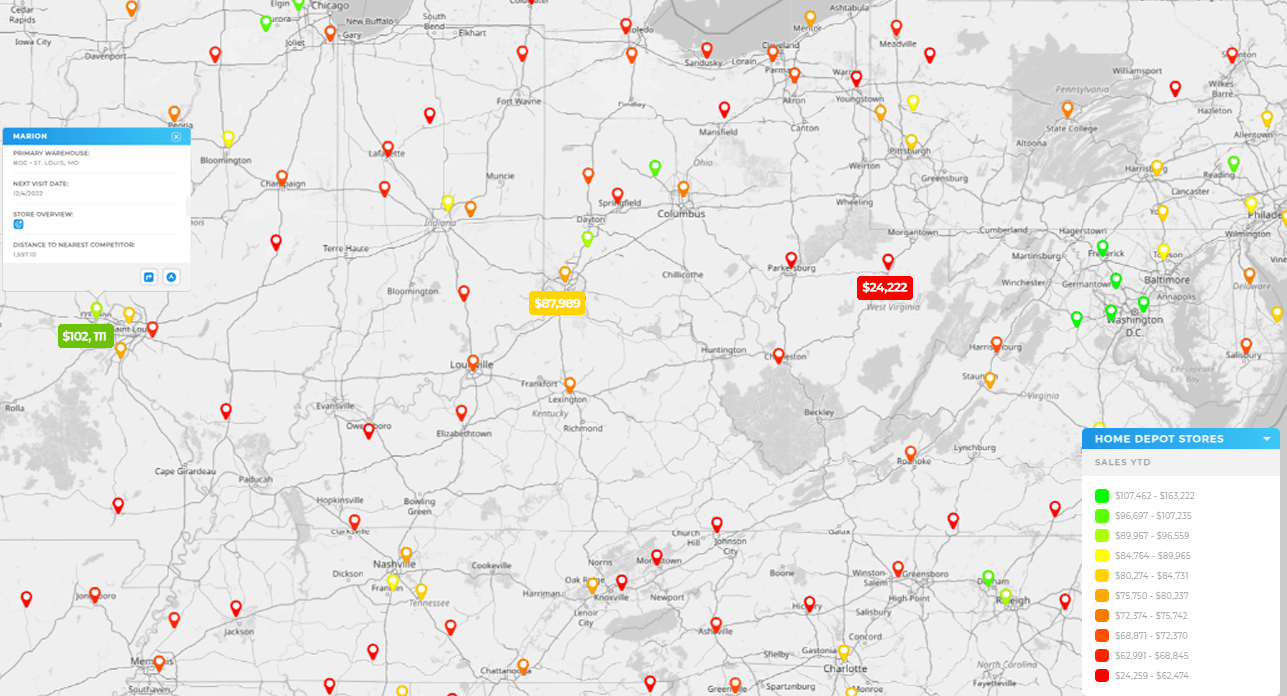

Pro Tip: Don’t just build dashboards—build habits. The most effective BI tools aren’t just visually appealing; they’re operationalized into daily workflows. Set up automated dashboard emails for each department, so teams see their KPIs without even logging in. With Mapline’s Geo BI, you can schedule map-based reports, automate alerts when thresholds are met, and share filtered views with just the right team members—keeping insights flowing and action timely.
Why BI Tools Are Essential for Every Department
Modern business intelligence isn’t limited to analysts. Today, BI powers decisions across marketing, sales, operations, finance, and leadership. Each department has its own goals, metrics, and workflows—but they all rely on the same thing: accurate, timely insight.
- Sales: Track pipeline health, regional performance, and quota attainment
- Operations: Optimize resource allocation, productivity, and delivery timelines
- Marketing: Measure campaign ROI, audience engagement, and channel effectiveness
- Leadership: Monitor high-level KPIs and make strategic decisions faster
Mapline enables true cross-functional analytics by giving each team access to the insights they need—without technical bottlenecks or slow reporting cycles. From marketing BI software to operational BI tools, Mapline puts data in everyone’s hands.
Key Features to Look For in Modern BI Platforms
Modern business intelligence platforms have come a long way from static reports and clunky spreadsheets. Today’s tools are built for speed, flexibility, and cross-functional use—empowering every team to explore data and make informed decisions in real time. Whether you’re leading sales, marketing, operations, or finance, the right BI platform should adapt to your workflows and uncover insights without requiring a data science degree. From intuitive dashboards to self-serve reporting and advanced geo analytics, the best platforms blend power with usability. In this section, we’ll explore the must-have features that separate modern BI tools from outdated systems.
Interactive BI Analytics Tools
The best BI tools let you do more than view charts—they let you explore your data. With interactive analytics tools, users can filter by region, click into subgroups, or toggle between time periods—all within the same dashboard. Mapline’s platform adds another layer: geography. With our embedded mapping engine, your dashboards become fully location-aware, enabling powerful data exploration software that makes trends easier to spot and act on.
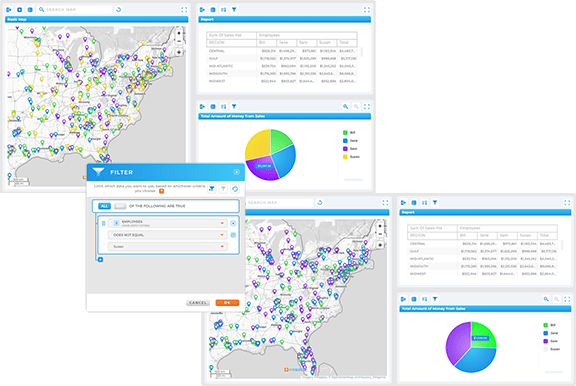
Self-Service BI for Every Role
Waiting on a report shouldn’t be a bottleneck. That’s why top self-service BI tools give non-technical users the ability to ask questions and generate insights on their own. With Mapline, users can build their own business reporting tools by dragging and dropping data fields, choosing filters, and applying visual logic. You get the speed of self-service, without compromising accuracy or security.
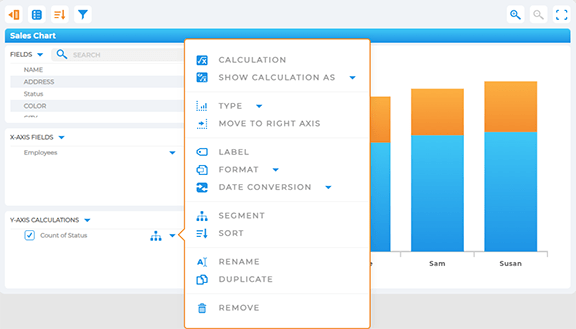
Data Storytelling and Dashboards Using BI Tools
Data alone doesn’t drive change—stories do. Data storytelling platforms like Mapline help you craft clear, compelling narratives from your data. Our business performance dashboards combine charts, tables, and interactive maps into visual workflows that guide decision-making. With built-in filters and export options, it’s easy to share your findings across teams and leadership—no slide decks required.
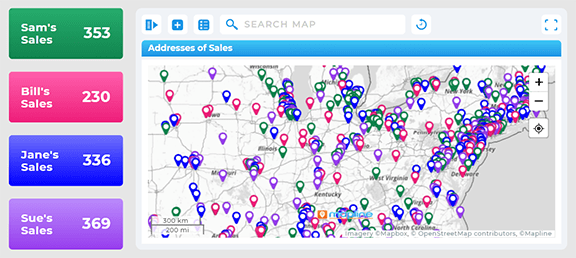
Why Mapline Is More Than Just Another BI Tool
Many tools claim to be part of the top BI space—but most offer the same dashboard templates and analytics views. Mapline goes a step further by combining robust BI functionality with intuitive geo analytics, automation tools, and seamless team collaboration.
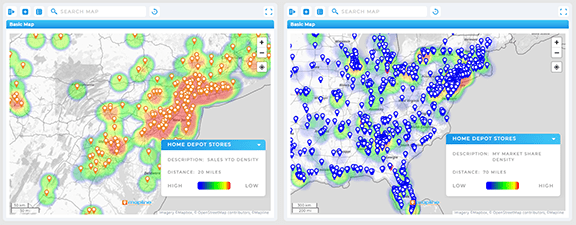
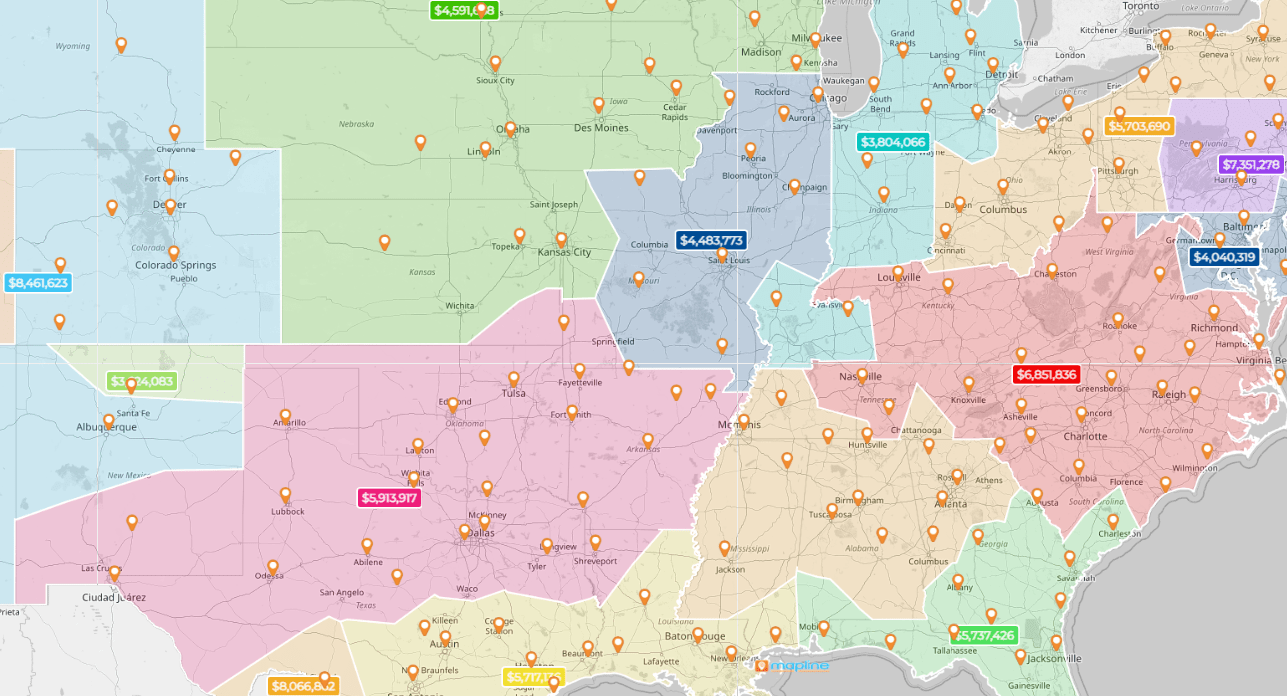
- Map-Based Dashboards: Visualize KPIs by region, sales territory, or customer cluster
- Custom Filters: Slice and dice data by rep, region, or performance metric
- Instant Sharing: Share dashboards securely with leadership, reps, or departments
- Automation: Schedule report refreshes or receive alerts based on thresholds
As a powerful enterprise BI software, Mapline supports everything from team-level reporting to C-suite analytics. You don’t need a data science degree to use it—just a desire to make better decisions, faster. And unlike other top BI platforms, Mapline is easy to set up, easy to scale, and surprisingly affordable.
Real-World Use Cases of Geo BI
Here’s how real businesses use Mapline as their go-to business intelligence tool:
- Field Service: Monitor technician performance by territory, job type, and customer satisfaction
- Sales Leadership: Track rep activity, close rates, and regional trends in a single dashboard
- Marketing Teams: Analyze campaign effectiveness by geography, audience segment, or channel
- Operations: Optimize staffing, shift timing, and supply chain movement using real-time visuals
In every case, Mapline’s spatial logic adds context traditional BI can’t match—making it a smarter choice for any team that works across locations or territories.
How to Get Started With Mapline Geo BI in Minutes
Mapline is built for speed—no lengthy implementations, consultants, or IT overhead required. Here’s how to launch your first dashboard:
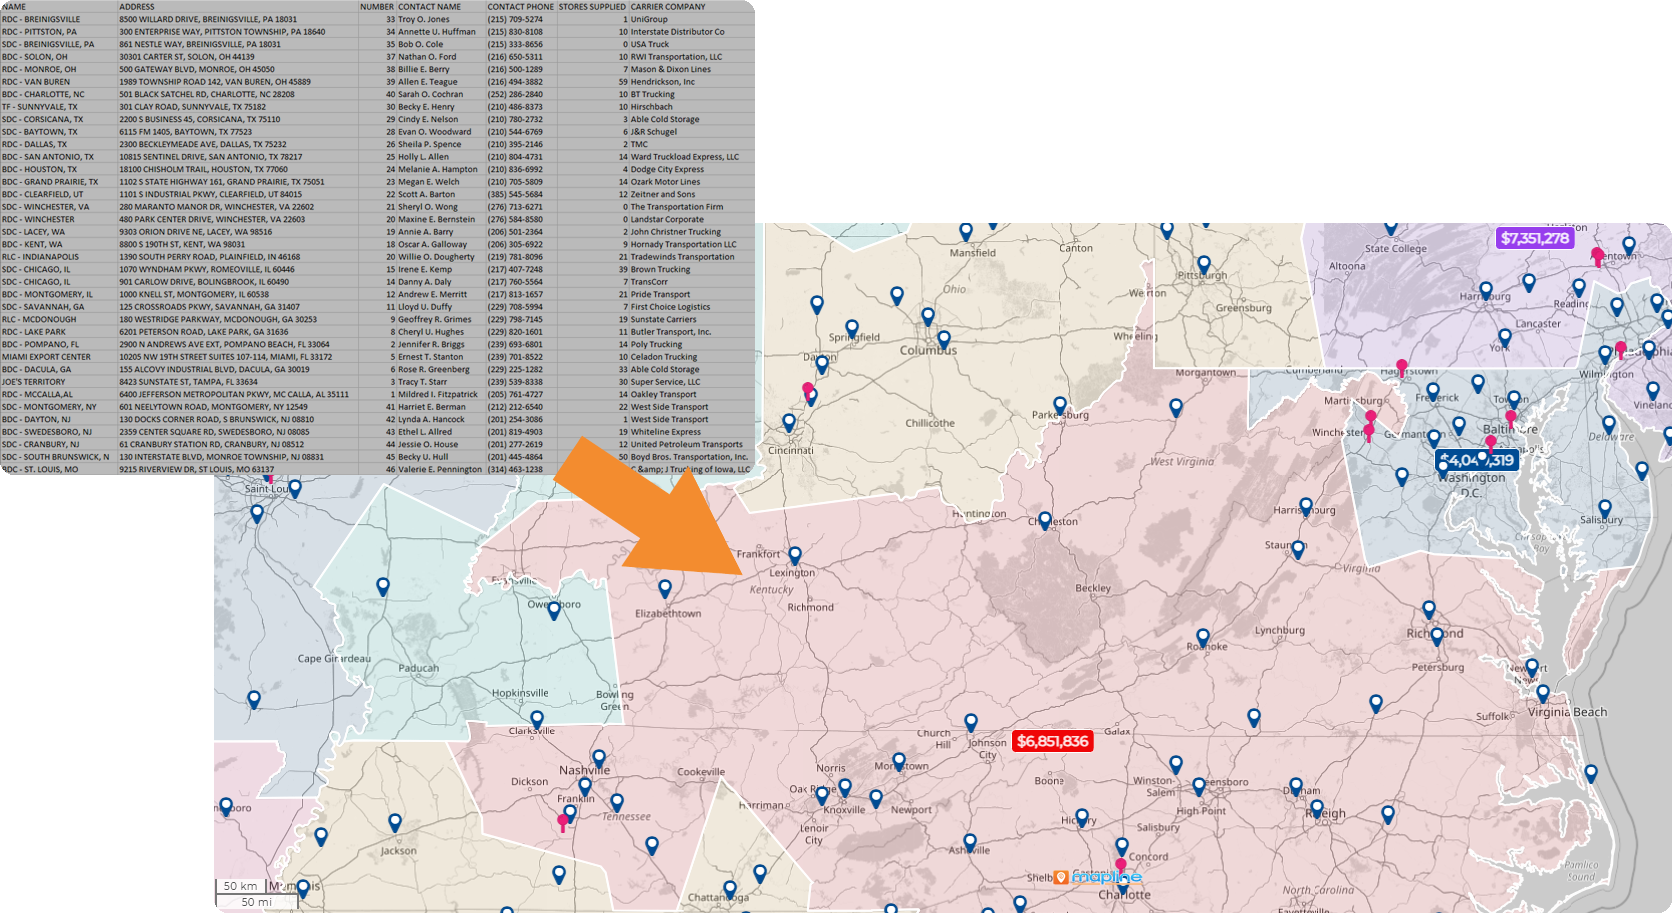
- Upload your data: Use Excel files, live integrations, or manual inputs
- Build your dashboard: Drag in metrics, charts, filters, and maps
- Customize: Choose which data appears for which users, and adjust your visual hierarchy
- Share: Publish dashboards via link, user permissions, or embedded widgets
- Automate: Schedule refreshes, alerts, or custom views based on activity
From setup to insights, it takes just minutes—not weeks—to start making smarter decisions with Mapline.
Get the Most Out of Business Intelligence Tools
Business intelligence isn’t just for analysts anymore. With the right platform, every team member can gain the insights they need to perform better, faster, and more strategically. Today’s top business intelligence tools combine powerful analytics with intuitive interfaces and real-time collaboration.
Mapline is built to empower every user—from sales managers to marketers to operations leaders. With features like map-based dashboards, drag-and-drop reports, and instant automation, it’s the easiest way to turn your data into direction. Ready to see smarter results across your organization? Start building with Mapline today.
Traditional reports are static snapshots in time, often created manually. BI tools provide real-time, interactive dashboards that update automatically and allow users to explore data dynamically.
Mapline is easier to use, faster to deploy, and includes built-in geo mapping. While Tableau and Power BI require extensive setup, Mapline users can create dashboards in minutes—with no technical background needed.
Absolutely. Mapline was built for business users, not analysts. Its drag-and-drop interface, prebuilt templates, and intuitive filters make it easy for anyone to explore data and build powerful dashboards.
Yes—Mapline’s marketing BI software features include campaign tracking, lead funnel analytics, regional engagement stats, and more. You can layer marketing data with customer locations for even deeper insight.
Every industry can benefit—from sales and logistics to healthcare and education. Any team that relies on timely decisions, resource management, or performance tracking will see immediate ROI from BI adoption.


