Close
WE'RE ALL ABOUT
YOUR
SUCCESS
HOW WOULD YOU LIKE TO GET IN TOUCH:
Email
Calendar
Close
READY FOR MAPLINE TO
ROCK
YOUR WORLD?
Our team is ready to help you eliminate wasted time, maximize your sales coverage, and supercharge your team's efficiency. We'll provide the expert guidance and tailored solutions you need to get things right.
Stop missing out on valuable opportunities. Reach out, and we'll get started on optimizing your territories today!
Email
Calendar
Close
READY FOR MAPLINE TO
ROCK
YOUR WORLD?
WE WANT YOU TO EXPERIENCE EVERY-THING YOU'VE BEEN MISSING BY STARTING YOUR FREE TRIAL TODAY! OUR TEAM IS READY TO HELP CHANGE YOUR LIFE. SO REACH OUT AND WE'LL GET THINGS STARTED!
Email
Calendar
Close
READY FOR MAPLINE TO
ROCK
YOUR WORLD?
Discover the potential of Mapline with a LIVE DEMO from our experts. This is your chance to see it in real-time and get all your questions answered. Connect with us to schedule your demo today!
Email
Calendar
Close
Give us a call. We'd love to talk!

+1 800.969.1454

Close
Give us a call. We'd love to talk!

+1.888.670.3795

Close
Close
Geo Mapping Starter Close

Experience the power

Get ready to see your data in a whole new way!
Geo BI Trial Close

Experience the power

Get ready to see your data in a whole new way!
Your 7-day free trial awaits!
Geo Routing Trial Close

Experience the power

Get ready to see your data in a whole new way!
Your 7-day free trial awaits!
Geo Scheduling Trial Close

Experience the power

Get ready to see your data in a whole new way!
Your 7-day free trial awaits!
Close
Close
Robust Reporting:
How to Make Your
Analytics Actually Actionable
Robust Reporting:
How to Make Your
Analytics Actually Actionable
  • Blog
  • Geo BI
  • Robust Reporting: How to Make Your Analytics Actually Actionable

Robust reporting transforms raw data into insights your team can understand, trust, and use to make faster decisions. Most businesses collect enormous amounts of information, but without clear, structured reporting, those insights never translate into action. Actionable analytics require consistency, clarity, and context — not just rows of numbers or static charts. Strong reporting helps teams spot patterns, anticipate challenges, and address operational gaps before they escalate. When your reports evolve from informational to actionable, every department gains the power to move with confidence.

Why Most Reports Fail to Drive Real Action

Many reports fall short because they present data without direction. Charts lack context, dashboards are cluttered, and metrics don’t connect back to meaningful business outcomes. Teams receive information, but not insight. When reports overwhelm instead of clarify, leaders struggle to identify what matters and what needs attention. Robust reporting solves this by focusing on relevance, consistency, and narrative structure. With cleaner visuals and smarter organization, decision-makers can interpret trends quickly and act immediately.

BI software takes you beyond static reports and uncovers trends, patterns, and opportunities in real-time
magnifying glass with a checkmark inside

Pro Tip: Make your reports actionable by pairing every key metric with a recommended next step. When teams know both the insight and the action it suggests, performance improvements happen faster and more consistently.

Too Much Data Creates Noise, Not Insight

When dashboards collect every available metric, teams get lost in the clutter. Irrelevant KPIs bury important signals and slow down analysis. Robust reporting curates data, highlighting only what drives performance or impacts decisions. This reduces cognitive load and helps teams focus on what actually moves the needle rather than what merely fills space.

Worker frustrated by spreadsheets and pivot tables

Reports Without Context Leave Teams Guessing

Charts and summaries only become actionable when paired with meaningful explanations. Without context — such as historical comparisons, benchmarks, or clear trends — teams must interpret meaning on their own. This leads to inconsistent interpretations and missed opportunities. Robust reporting adds essential framing so insights are clear, aligned, and immediately useful.

Mapline's Territory Mapping Software

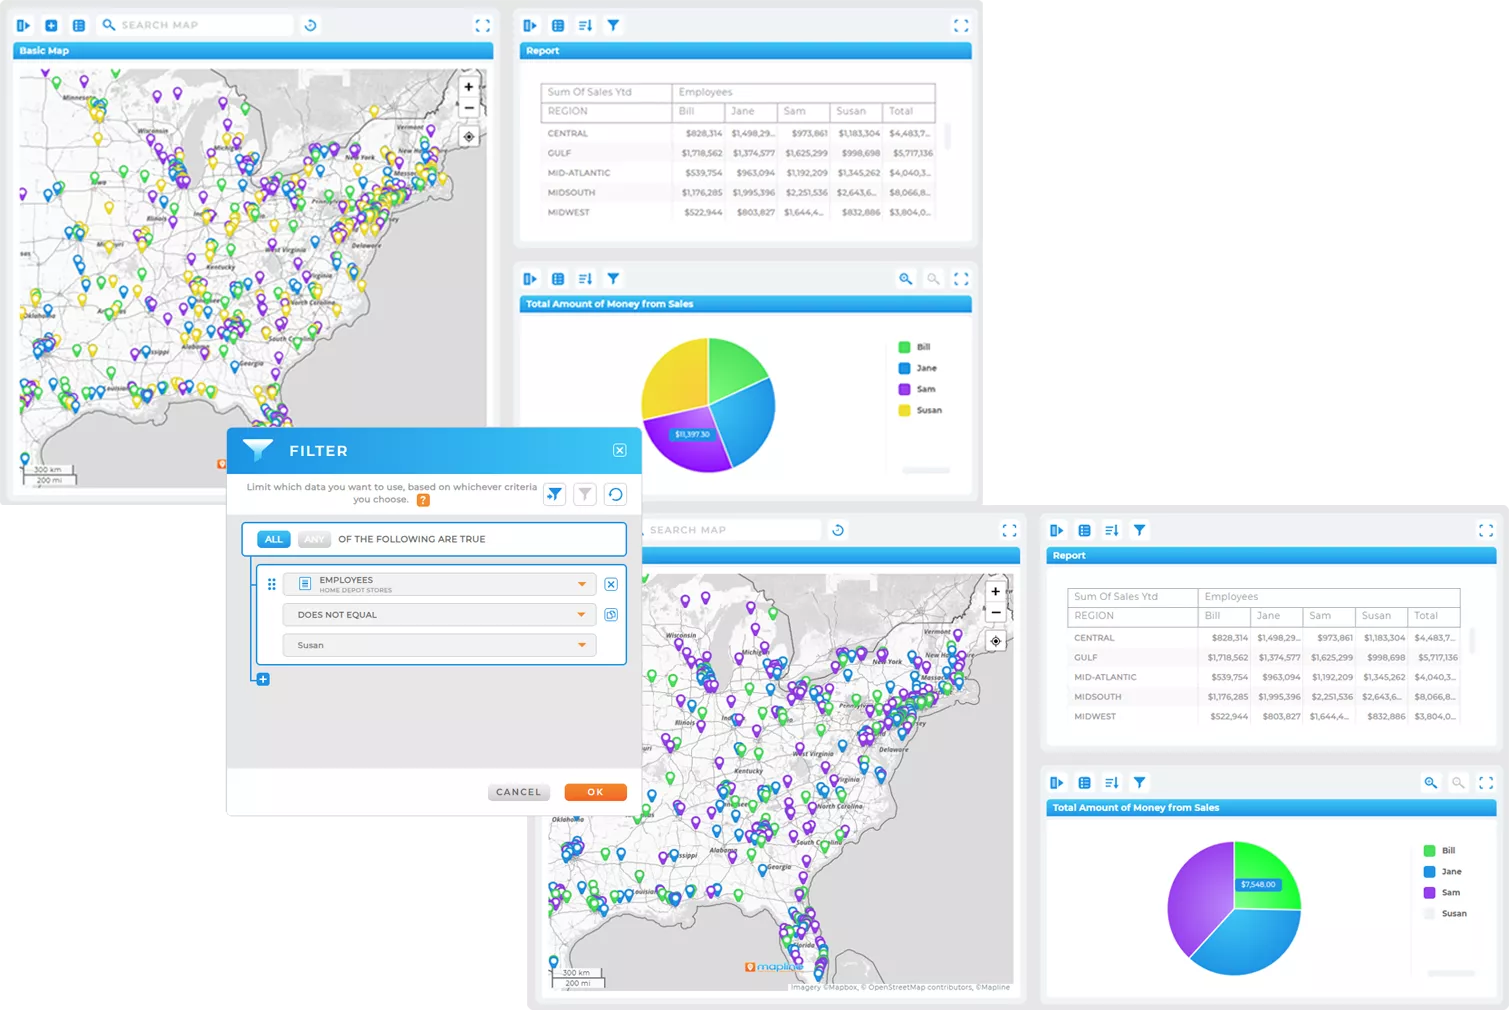
Static Dashboards Can’t Keep Up With Fast-Moving Operations

Static or outdated dashboards fail to reflect what’s happening right now, leading to decisions based on stale information. When conditions shift quickly, real-time reporting becomes essential for teams managing logistics, field service, sales, or customer support. Robust reporting incorporates live data streams to ensure dashboards reflect current activity, empowering teams to act at the exact moment action is needed.

Example of a static dashboard

What Makes Reporting Truly Actionable

Actionable reporting surfaces insights that are timely, relevant, and tied to specific outcomes. The right structure transforms reports from passive updates into active decision-making tools. Effective reporting identifies what’s going well, where risks are emerging, and what needs to be fixed. By aligning metrics with business goals, teams get a clear roadmap for improvement rather than a list of disconnected numbers. Actionable insights turn uncertainty into confidence and motion into measurable progress.

Clear, Outcome-Focused KPIs

Every report should reflect the outcomes the business cares about most — whether that’s delivery completion rates, sales growth, technician productivity, or customer satisfaction. Clear KPIs connect data directly to results. When teams understand how each metric contributes to performance, it becomes easier to align daily decisions with strategic goals.

Real World Use Cases for Business Geoanalytics

Trendlines and Comparisons for Faster Interpretation

Comparisons across time, region, or teams reveal patterns that raw numbers cannot. Trendlines highlight whether performance is improving or declining, helping leaders react before small issues become major setbacks. Comparisons make performance clearer and reduce the ambiguity that often accompanies isolated data points.

screenshot of a Mapline chart with the calculated fields window open

Automated Insights That Call Out What Matters

Smart reporting systems automatically highlight anomalies, outliers, or performance changes that need attention. This removes the guesswork of hunting through dashboards for issues. Automated insights save time and guide teams toward immediate action, ensuring no critical pattern is overlooked.

Geo BI : Dynamic dashboards give you real-time insights and more control

How Robust Reporting Improves Cross-Team Alignment

When teams rely on consistent, well-structured reports, communication becomes smoother and decision-making becomes faster. Robust reporting creates a shared source of truth that eliminates conflicting interpretations across departments. This alignment ensures that sales, operations, customer service, and leadership all work from the same insights. Clear reporting also reduces redundant meetings and back-and-forth conversations by providing answers upfront. Strong alignment moves the entire organization forward more efficiently.

Consistent Formats Reduce Miscommunication

Using a standard reporting structure makes insights easier to interpret across teams. When everyone knows where to find KPIs, how metrics are calculated, and what each chart represents, conversations become more productive. Consistency removes the friction of constantly re-explaining data sources or definitions. Over time, this standardized approach strengthens operational clarity.

Visual Maps Expose Operational Gaps

Layering maps into dashboards adds spatial context that traditional reports lack. Visualizing territories, customer clusters, delivery delays, or asset locations helps teams identify geographic trends quickly. This spatial insight drives smarter decisions about resource distribution, regional workload, and market opportunities. Maps make reporting more intuitive and immediately actionable.

Target audience segmentation is key to understanding your audience

Shared Dashboards Keep Everyone on the Same Page

Centralized dashboards that update in real time ensure that all departments work from the same information. This prevents outdated spreadsheets from circulating and eliminates discrepancies between teams. Shared visibility builds trust and encourages collaborative problem-solving. When everyone sees the same story, they can pursue the same goals.

Heatmap analytics tools help different industries maximize ROI
What makes a report “robust”?

Reports are robust when they are clear, consistent, contextual, and tied to meaningful outcomes.

Why do most dashboards become cluttered?

Overloading them with unnecessary metrics dilutes focus and makes insights harder to interpret.

How does real-time reporting help?

It ensures decisions are based on current conditions rather than outdated snapshots.

Do maps improve reporting clarity?

Yes — maps add spatial context that reveals patterns and operational gaps traditional charts miss.

Is robust reporting only for large enterprises?

No — any team can benefit from clearer, more actionable analytics regardless of size.

MAKE YOUR ANALYTICS ACTIONABLE WITH ROBUST REPORTING