Traditional reporting systems like Excel used to be the gold standard for tracking performance. But today’s businesses need more than just rows and columns—they need instant insights, interactive visualizations, and tools that adapt to fast-changing priorities. That’s where modern BI software comes in.
With the right BI tools, businesses can go beyond static reports and uncover trends, patterns, and opportunities in real time. Let’s explore how BI software like Mapline stacks up against traditional reporting methods, and why it’s becoming the go-to solution for data-driven teams.
Reporting vs. Analytics: What’s the Difference?
While reporting and analytics are often used interchangeably, they serve different purposes. Traditional reporting focuses on what has already happened—think static spreadsheets or PDF summaries of last quarter’s performance. Analytics, on the other hand, explores why things happened, what might happen next, and how to improve outcomes. It’s predictive, dynamic, and interactive.
BI software combines both reporting and analytics, giving users the power to not only view past data but also uncover trends and opportunities. Platforms like Mapline deliver visual dashboards that show the full story, not just numbers on a page. With filters, drill-downs, and dynamic updates, it’s easier to act fast and make informed decisions. Simply put, analytics takes reporting to the next level.


Pro Tip: Pro tip goes here.
Traditional Reporting: Where It Falls Short
Spreadsheets like Excel have long been a staple for business reporting. But as teams grow and data becomes more complex, these tools quickly hit their limits. Reports must be manually updated, version control becomes a nightmare, and there’s little room for interactivity or real-time visibility. Mistakes are common, and insights are often buried in data dumps that no one has time to sift through.
For businesses managing field operations, multiple territories, or fast-moving teams, this kind of lag can lead to missed opportunities and costly decisions. Traditional reporting was built for a slower pace; and modern business is anything but. That’s why many companies are turning to BI software that automates data flow and makes reporting smarter and faster.

How BI Software Changes the Game
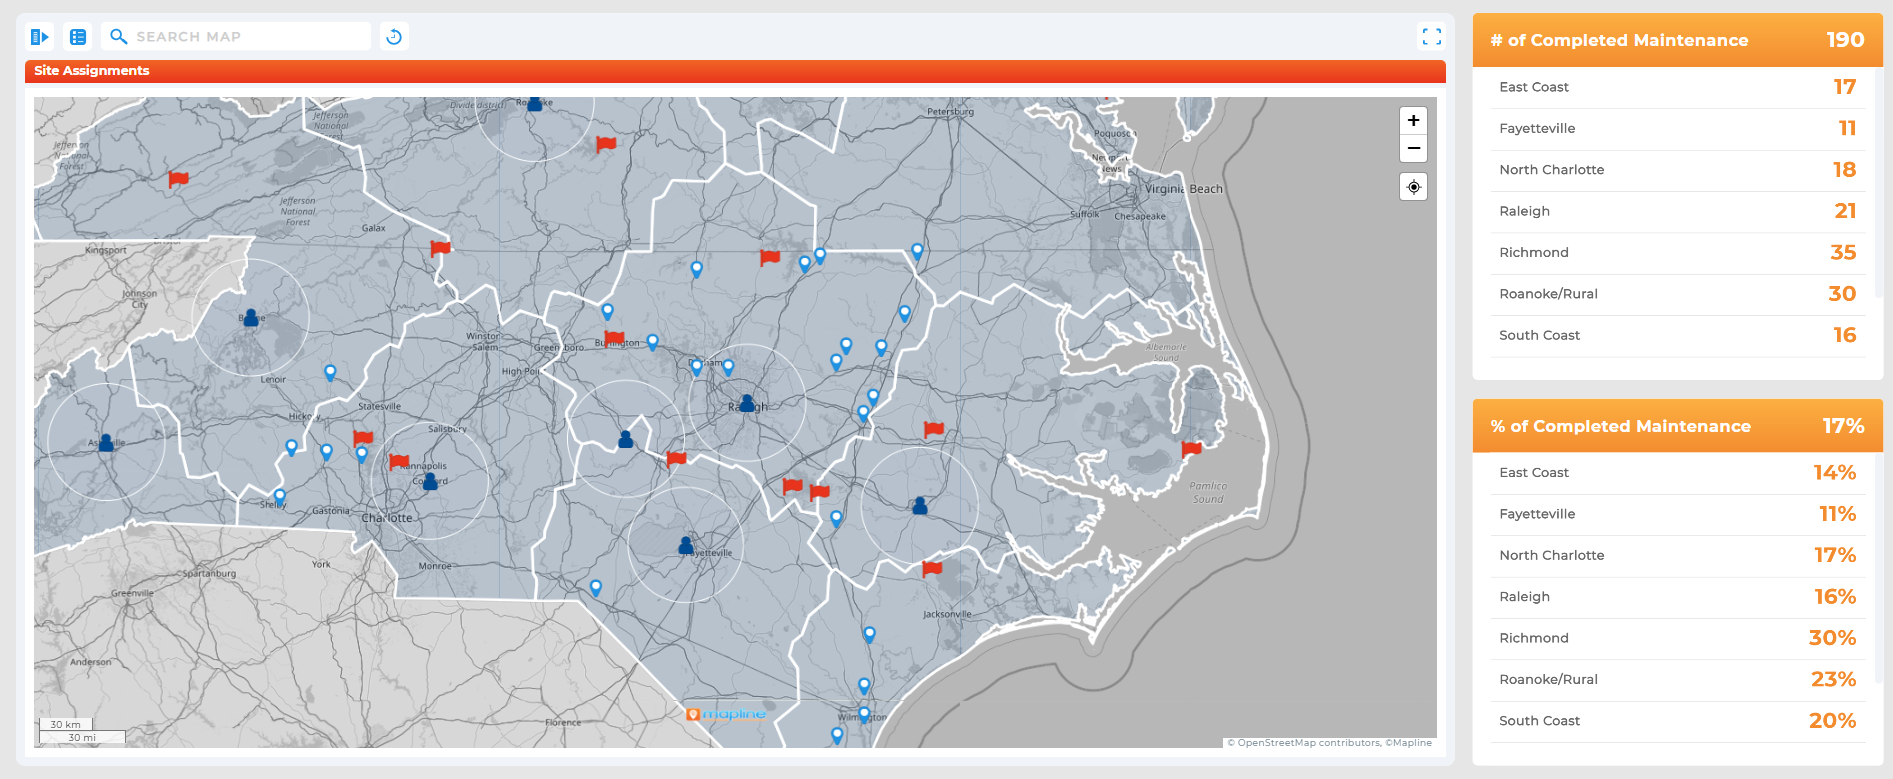
Modern BI software offers real-time dashboards, automated updates, and interactive views that help teams make faster, smarter decisions. Instead of emailing spreadsheets back and forth, users can log into a shared platform, explore data visually, and collaborate instantly. Mapline’s dashboards, for example, update dynamically, so reps in the field, execs in the office, and everyone in between can see the same data at the same time.
This level of visibility changes how companies operate. From spotting regional sales trends to tracking delivery performance, BI tools provide the kind of clarity traditional reports simply can’t. They eliminate bottlenecks, reduce manual work, and give leaders the confidence to move quickly and decisively.

Why Teams Prefer Interactive Dashboards
Static reports limit how users can engage with their data. You can look at it, but you can’t ask questions, explore patterns, or see updates in real time. Interactive dashboards flip that script. They let users drill into details, compare metrics, apply filters, and zoom in on specific timeframes or regions, all with just a few clicks.
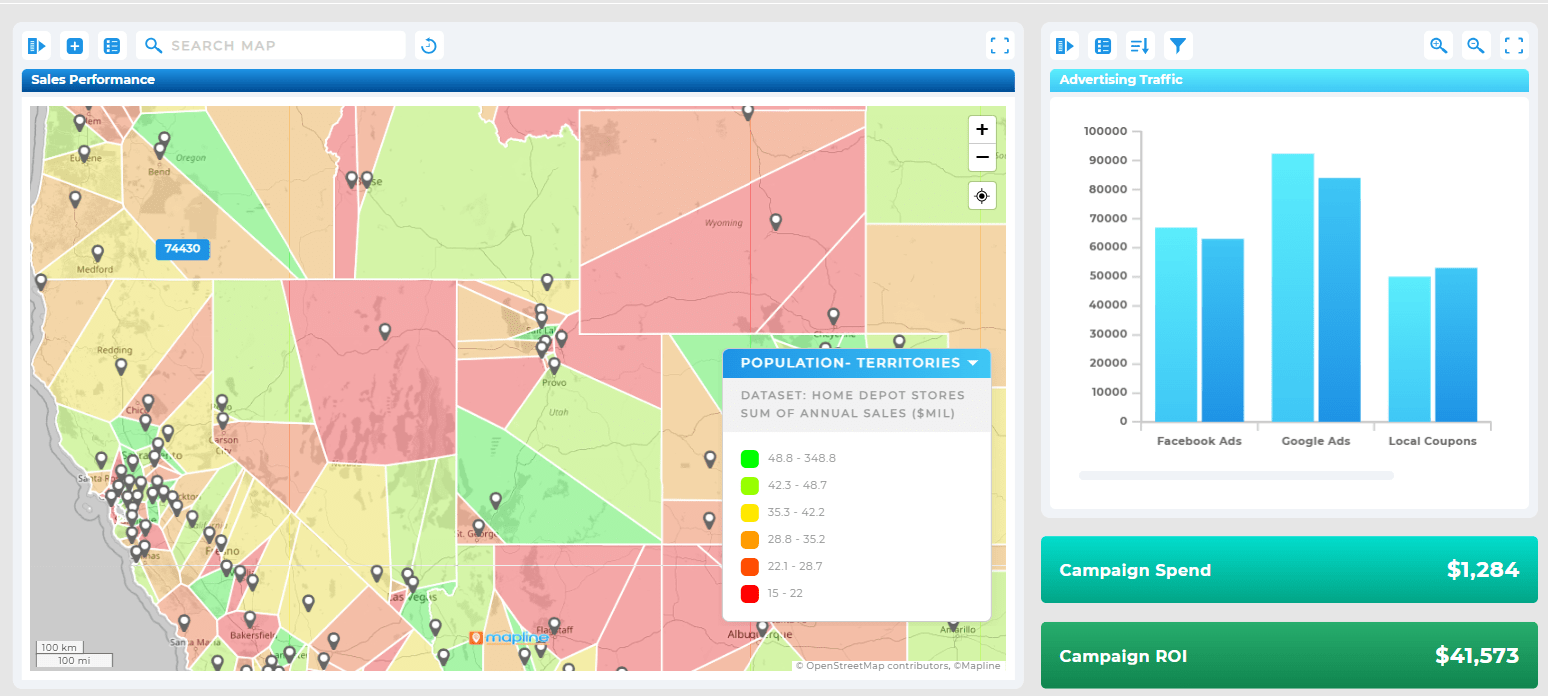
Mapline’s dashboards are especially powerful for sales, service, and field teams that need to act on location-based data. Whether you’re tracking territory performance or planning service calls, you get a clear, map-based view of what’s working and what’s not. That level of insight makes it easier to coach reps, adjust strategy, and stay ahead of the curve.

BI Software Features That Make the Difference
Not all BI tools are created equal. The best platforms deliver real-time data, interactive visuals, self-service analytics, and integrations with the tools your team already uses. Mapline adds another layer with geographic intelligence, turning your data into maps that show customer clusters, rep territories, delivery routes, and more.
Other features like automated report scheduling, customizable dashboards, and drag-and-drop visualizations make it easier for every department to use data effectively. Whether you’re managing a sales team or optimizing service zones, BI software puts the power of data directly in your hands—no analyst required.
Use Case Examples: BI in Action
Let’s say your sales team is struggling to hit targets in a few regions. A traditional report might tell you total sales by ZIP code, but it won’t explain why performance is lagging. With a BI tool like Mapline, you can layer in customer data, rep activity, and past performance to uncover what’s really going on. Is the territory unbalanced? Are reps spread too thin? Is there untapped opportunity in nearby areas?
Or take a service team that’s managing hundreds of appointments a week. A spreadsheet might help you track visits, but it won’t show route efficiency or missed opportunities. Mapline’s BI dashboards let you visualize performance on a map, optimize schedules, and pinpoint bottlenecks before they impact the customer experience. It’s not just reporting—it’s strategy in real time.
The Mapline Difference
Unlike BI platforms that require days of setup or specialized training, Mapline is ready to use right out of the gate. It’s built for busy teams that need clarity fast—without sacrificing power or precision. With map-first visualizations, dynamic dashboards, and easy automation, Mapline helps you get more from your data without the complexity of traditional reporting systems or bulky enterprise tools.
Other platforms may check the boxes—but Mapline delivers results. Whether you’re visualizing team coverage, forecasting sales, or fine-tuning operations, it’s the smarter, simpler way to work with data.
Trade Spreadsheets for Strategic Insights
Traditional reports still have their place—but they’re not enough in today’s fast-paced environment. Businesses need tools that can adapt, visualize, and respond in real time. BI software like Mapline turns data into decisions by giving you the clarity and control that spreadsheets simply can’t offer. If you’re ready to leave static reporting behind and step into a smarter way of working, Mapline is here to help.
Traditional reporting uses static documents (like Excel or PDF reports) to show what has already happened. BI software provides real-time, interactive dashboards that help users explore data, identify patterns, and make decisions faster.
Not with platforms like Mapline. While some BI tools require advanced setup or data analysts, Mapline is designed to be user-friendly—even for non-technical teams.
Mapline stands out for its simplicity, speed, and geo-intelligence. It offers dynamic maps and dashboards without the complexity of tools like Tableau or Power BI.
It depends on your needs. BI software complements Excel by handling real-time reporting, automating updates, and enabling interactive data exploration—capabilities spreadsheets can’t match at scale.
BI software is valuable across industries—from healthcare and logistics to retail and field services. Any team that needs to visualize trends, monitor performance, or make data-backed decisions in real time can benefit.


