EXPERIENCE THE MOST
POWERFUL
MAPPING
SOFTWARE ON THE
PLANET

Your Maps, Your Way
Use our powerful visualization tools to discover all your data has to offer!

Map from spreadsheets
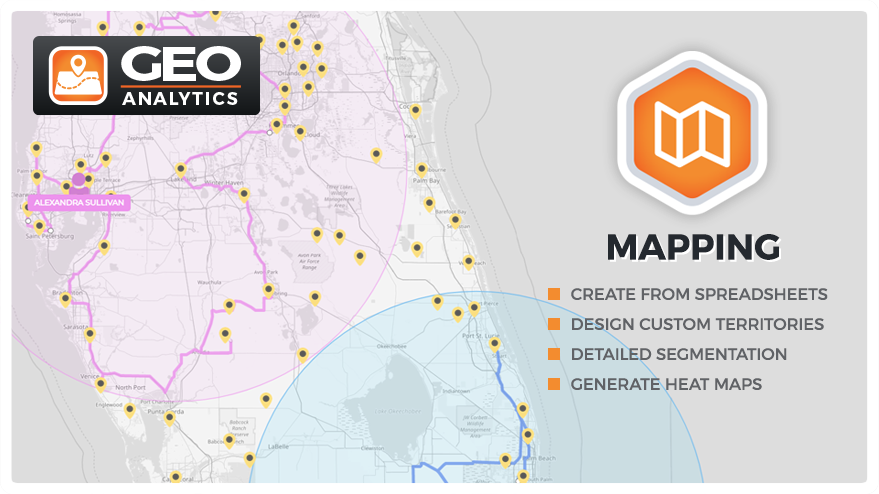
Importing your data and transforming it into a powerful visual couldn’t be easier — simply copy your excel or spreadsheet data and paste it into Mapline to instantly generate a map!

Customized pins
Mapline can help to quickly convey information using dynamic pins. Automatically set colors, shapes, sizes, add labels based on columns from your spreadsheet.

Create territories
Design your own boundaries to segment and analyze your data. Custom territories allow you to tailor your maps to your specific needs, providing insights and clarity for better decision-making.

Heat mapping
Want a visually intuitive way of seeing the concentration of your data? Heat mapping offers a variety of solutions, including territory-based maps that make it easy to emphasize your success.

Segment Pins
Importing your data and transforming it into a powerful visual couldn’t be easier — simply copy your excel data and paste it into Mapline to instantly generate a map!

Share & Embed
Extend the impact of your maps seamlessly. Share interactive maps with stakeholders or embed them directly into your website, ensuring easy access and engagement with your data-driven insights.

GOVERNMENT BOUNDARIES
Organize your map pins by adding territory boundaries like states, counties and postal codes for more precise spatial analysis and strategic planning.

EXPORT IMAGES
Showcase your maps in a powerpoint or other mediums by exporting a static image of your map as a .png file.

SATELLITE VIEW
Elevate your data visualization with detailed satellite imagery. Gain unique perspectives for in-depth analysis and presentations, enhancing your mapping experience with stunning visuals.

COVERAGE CIRCLES
Visualize your reach with Coverage Circles. Apply radius areas to your locations to show a specific mile range around each pin, making it easy to see your coverage at a glance.

Filter Pins
Refine your data visualization effortlessly. Filter pins based on criteria like values, labels, or custom attributes, ensuring clear insights and focused analysis tailored to your specific needs.

TERRITORY REPORTING
Click on any territory from your map to access all the information about data inside that territory. Quickly see which pins are inside each territory and their aggregated values from your spreadsheet data.
Analyze Everything
Think bigger than ever before with a wide variety of user-friendly analytics!

Identify trends
Stay one step ahead using tools like Segments, Filters, and Territory Reporting to help you discover all of the important trends in your data.

Improve efficiency
Making the best use of your time is critical, and Mapline can help! Create maps in seconds and perform in-depth analysis. Increase productivity and efficiency.

Mitigate risks
Mapline can help you create disaster recovery plans, determine weak links in your supply chain, and reveal the safest areas available: our tools will keep you prepared.

Data interaction
Understand how your data interrelates and can work together in powerful ways. From distance analysis and discovering growth opportunities to visualizing coverage networks, Mapline makes it easy!

Q: WHAT MAKES MAPLINE SO DIFFERENT?
A: OUR PROPRIETARY GEOSPATIAL ENGINE
Q: WHAT MAKES MAPLINE SO DIFFERENT?
A: OUR PROPRIETARY GEOSPATIAL ENGINE
We are the only software solution built from the ground-up on our innovative Geospatial technology that leverages the power of distance and location in your data. We let you see exactly where you are, then help you chart a course to where you want to be! We are the only software solution built from the ground-up on our innovative Geospatial technology that leverages the power of distance and location in your data. We let you see exactly where you are, then help you chart a course to where you want to be!


