In today’s hypercompetitive market, visibility matters. Businesses that understand how well they’re penetrating a market—whether by geography, customer demographics, or sales activity—gain a crucial edge. Data mapping software makes this possible, transforming raw data into interactive maps that reveal gaps, strengths, and new opportunities. From territory insights to heat maps of customer density, the right tools make complex information instantly clear.
The Role of Data Mapping in Market Analysis
Data mapping software takes spreadsheet-based data and layers it onto interactive maps, giving businesses the ability to see where they stand in a competitive landscape. Instead of sifting through numbers and reports, leaders can view customer penetration visually, track performance against territories, and plan for expansion. These insights aren’t limited to large enterprises—small and mid-sized businesses benefit equally from seeing where their customers are and where untapped demand lies.


Pro Tip: Pair your data mapping with Mapline’s territory mapping software to instantly see how market penetration connects to sales coverage. This makes it easy to identify gaps and adjust strategy without overhauling existing workflows.
From Basic Mapping to Advanced Visualization
The true strength of data mapping software lies in its ability to grow with your needs. While simple maps can highlight customer locations or sales regions, advanced visualizations unlock much deeper insights. By layering features such as heat maps, demographic overlays, and boundary-based segmentation, businesses can uncover patterns that remain hidden in spreadsheets. These insights help teams understand not just where customers are, but how effectively they are penetrating different markets. With the right visualization tools, decision-makers can compare performance across regions, detect service gaps, and forecast opportunities with precision. This flexibility ensures that data mapping is more than just a visualization exercise—it becomes a strategic advantage for long-term growth.
Territory Mapping and Market Segmentation
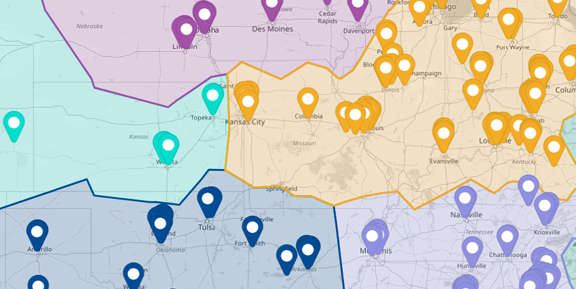
With territory mapping, sales teams can assign areas based on geography, customer type, or performance. This eliminates overlap, balances workloads, and ensures maximum coverage. For market penetration analysis, territory mapping shows whether certain areas are underdeveloped or thriving. Software like Power BI or Azure Maps may offer mapping features, but Mapline goes further by giving teams built-in tools for territory design and visualization without requiring complicated setups.

Heat Maps for Penetration and Density
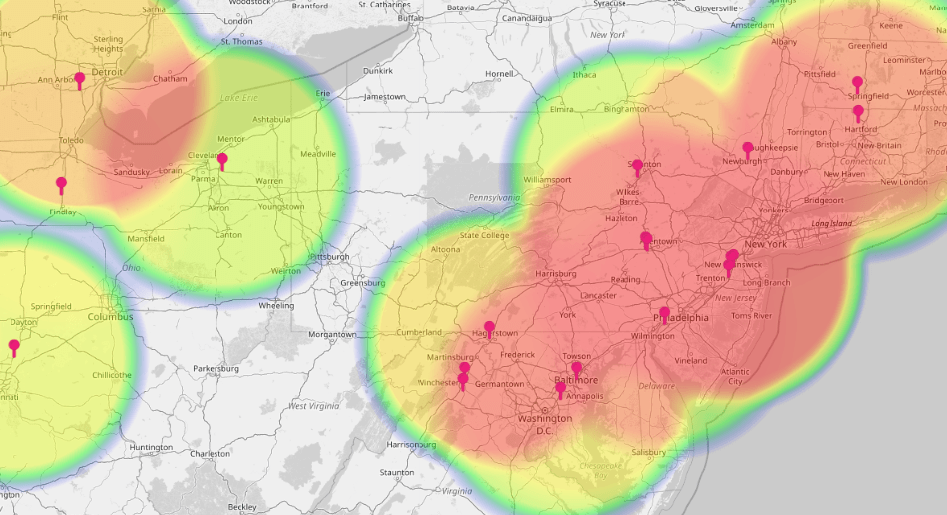
Heat maps provide a fast way to assess customer density, sales distribution, or competitive presence. By layering geographic data, businesses can see where they dominate and where their presence is thin. While Excel Power Map and Leaflet-based tools offer heat map capabilities, they often require plugins, add-ons, or technical know-how. Mapline provides a simple, intuitive approach with powerful visualization that doesn’t require a steep learning curve.

Demographic Data and Interactive Layers
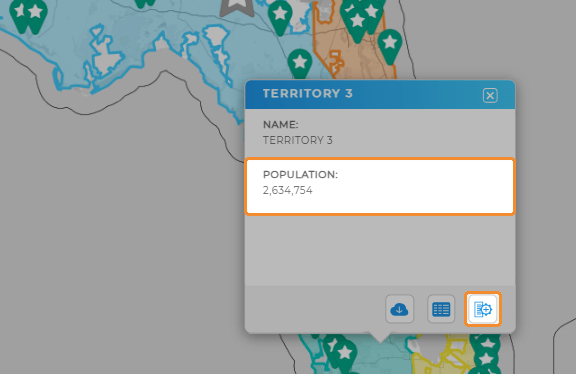
Understanding customers goes beyond location. By integrating demographic data into maps, businesses can see not only where their customers are but who they are. This allows smarter targeting, optimized campaigns, and better-informed expansion strategies. Mapline makes it easy to overlay demographics directly onto maps, creating an interactive view that connects customer behavior to geography.

Next Steps After Mapping Market Penetration
Visualizing market penetration is just the first step. With Mapline’s geo mapping software, businesses can immediately take action:
- Create zip code heat maps to refine campaigns and outreach strategies.
- Use territory management tools to rebalance workloads and increase efficiency.
- Integrate with sales territory mapping software to measure performance by region.
- Layer demographic data for precise customer segmentation and targeting.
- Leverage interactive demographics maps to plan future expansion with confidence.
By turning insights into action, businesses gain more than just a snapshot—they gain a roadmap for growth.
THE BOTTOM LINE
The true strength of data mapping software lies in its ability to scale alongside your business. Simple maps may start with plotting addresses or outlining sales regions, but advanced visualization takes it a step further by unlocking hidden insights. When you layer in heat maps, demographic overlays, and boundary-based segmentation, you begin to see patterns and relationships that spreadsheets alone can’t reveal. These deeper insights help teams understand market penetration, identify underserved areas, and pinpoint opportunities for expansion. With the right tools, decision-makers can analyze performance across regions, rebalance resources effectively, and plan for future growth with confidence. In this way, data mapping evolves from a basic visualization tool into a powerful engine for strategy and competitive advantage.
Data mapping software translates data from spreadsheets or databases into visual maps, making it easier to analyze geographic trends, customer behavior, and market penetration.
By displaying data on maps, businesses can quickly identify areas where they have strong coverage, weak penetration, or untapped potential.
Yes. Small businesses often benefit most from seeing their local customer base and opportunities for growth in a visual, easy-to-understand way.
Unlike platforms such as Power BI or Excel Power Map that require add-ons or technical skills, Mapline delivers a simple, intuitive solution with advanced mapping capabilities built in.
Yes. With Mapline, businesses can overlay demographic data, creating interactive maps that combine customer insights with geography for smarter targeting.


