Reporting Tools
Running a multi-location business means every decision has financial impact—across stores, regions, and territories. The challenge isn’t collecting data; it’s turning decentralized transactions, operating costs, and sales metrics into a unified view executives can actually use. That’s where financial reporting tools earn their keep. By centralizing performance data and surfacing location-level insights, these platforms help leaders protect margins, prevent waste, and allocate capital with confidence. The result is simple: clearer visibility, faster decisions, and a consistent path to profitability at scale.
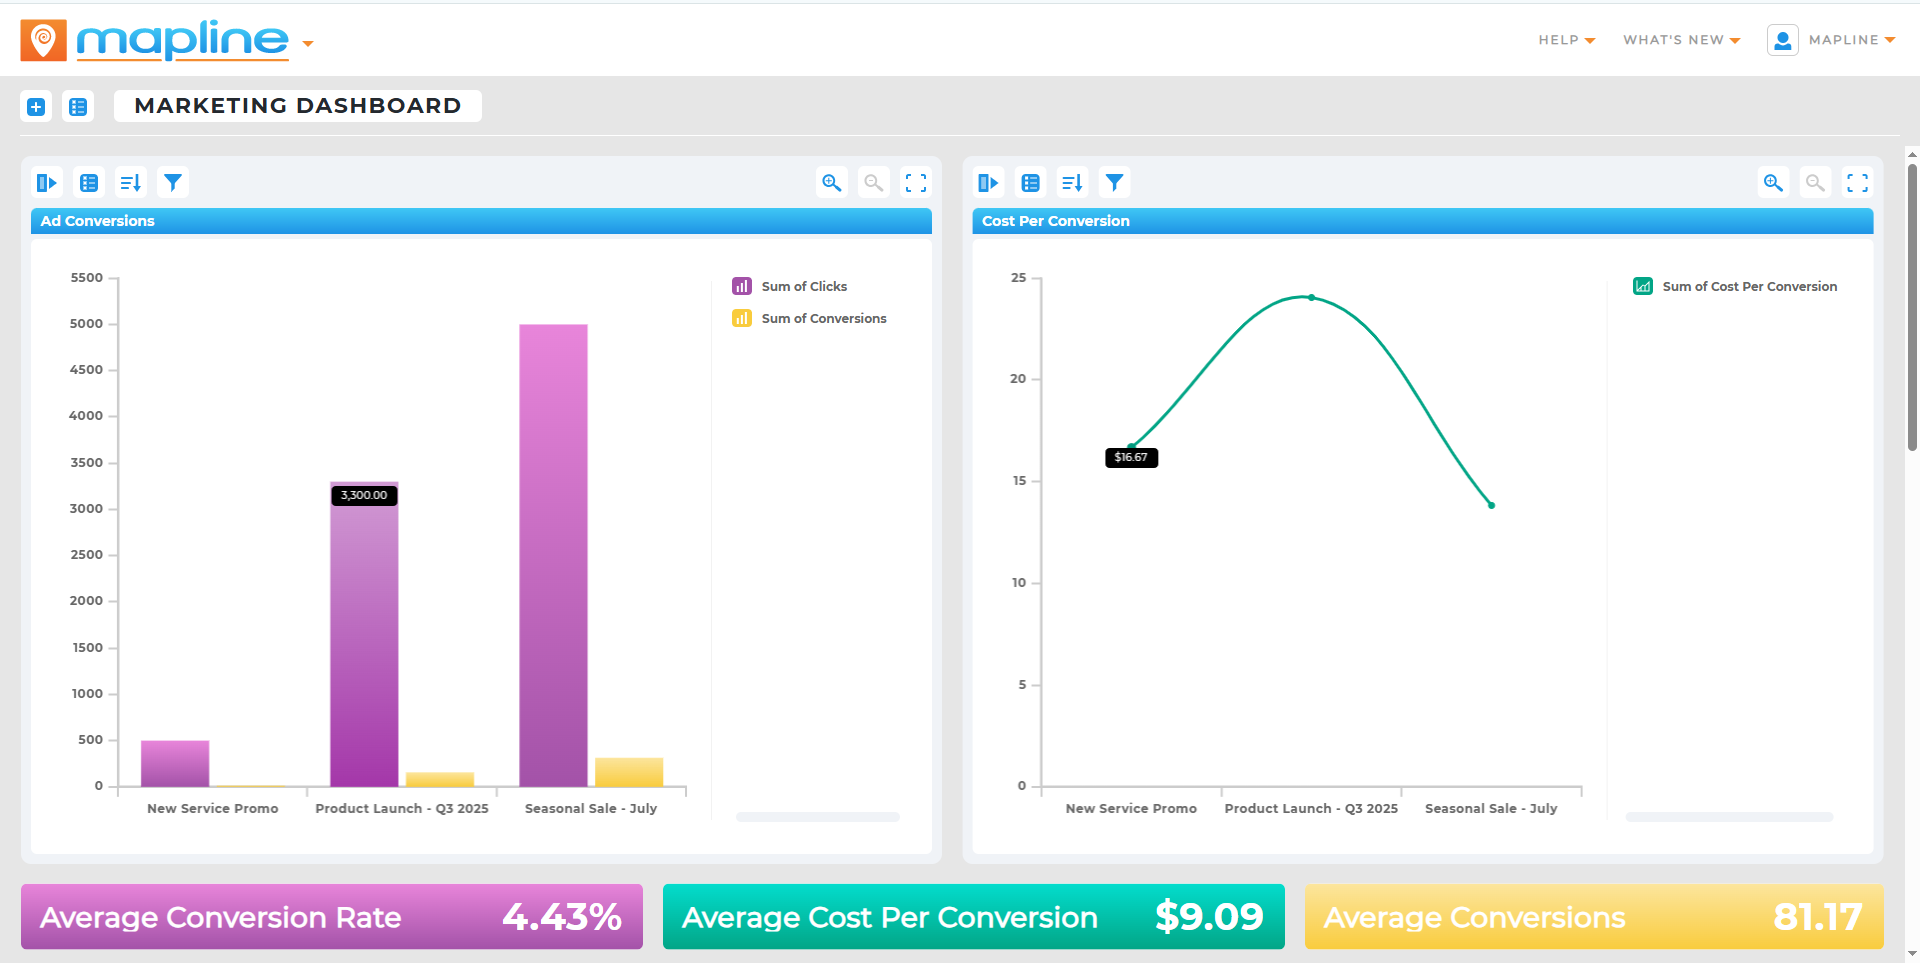

Pro Tip: Use your financial reporting tools to go beyond basic profit-and-loss tracking. With Mapline, you can connect location-based data to your reports, giving you visibility into which stores, branches, or regions are most profitable. This location-driven perspective helps you pinpoint where expenses are eating into margins and where growth opportunities are hiding. That’s just one way Geo Bi empowers you to make smarter investment decisions that keep every location pulling its weight.
What Multi-Location Finance Really Needs
Multi-location finance teams don’t just need a monthly roll-up—they need line-of-sight into which locations drive margin and which quietly drain it. That requires consolidated and granular views that reconcile quickly, flag anomalies, and make it easy to compare stores with similar profiles. Beyond accuracy, the tools must be fast, flexible, and accessible so operators can act without waiting on a specialist. Most importantly, insights should reflect regional context: neighborhood demographics, delivery zones, and territory boundaries all influence performance. When your financial reporting stack shows the numbers and the “where,” leaders can intervene before small issues become expensive trends.
Core Capabilities of Financial Reporting Tools for Multi-Location Operations
Best-in-class financial reporting tools combine trusted accounting outputs with operational context. They consolidate P&L results, visualize KPIs, and support forecasting while preserving the ability to drill from enterprise totals down to a single store. The most effective stacks also integrate with mapping and territory workflows to add geographic clarity to financial questions. This mix eliminates silos, speeds period close, and makes it easier to standardize how decisions get made. Below are the features that matter most when profitability depends on place as much as performance.
Consolidated and Location-Level P&L
Profit and loss software that rolls up and drills down with a click is the foundation for multi-location success. Finance teams need to see enterprise totals, then pivot into location-level labor, COGS, and discretionary spend to find the story behind variances. With consistent chart of accounts and standardized mapping, it becomes simple to benchmark similar stores and flag outliers. The payoff is a faster close and clearer accountability across regions. When the P&L is trustworthy and navigable, the right fix usually becomes obvious.
Financial KPI Dashboards by Region
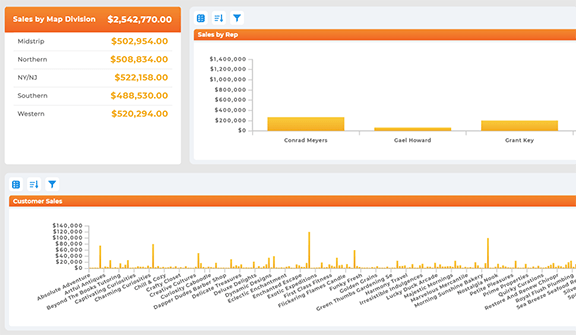
Financial dashboard software shines when it highlights what operators can influence immediately. A well-built financial KPI dashboard surfaces revenue per location, contribution margin, labor percent, and inventory turns alongside trendlines. Teams can filter by market, district, or territory to see where execution is strong and where coaching is needed. Dashboards that update frequently encourage proactive action rather than end-of-month reaction. That cadence keeps performance conversations focused, specific, and productive.
Budgeting and Forecasting with Geographic Context
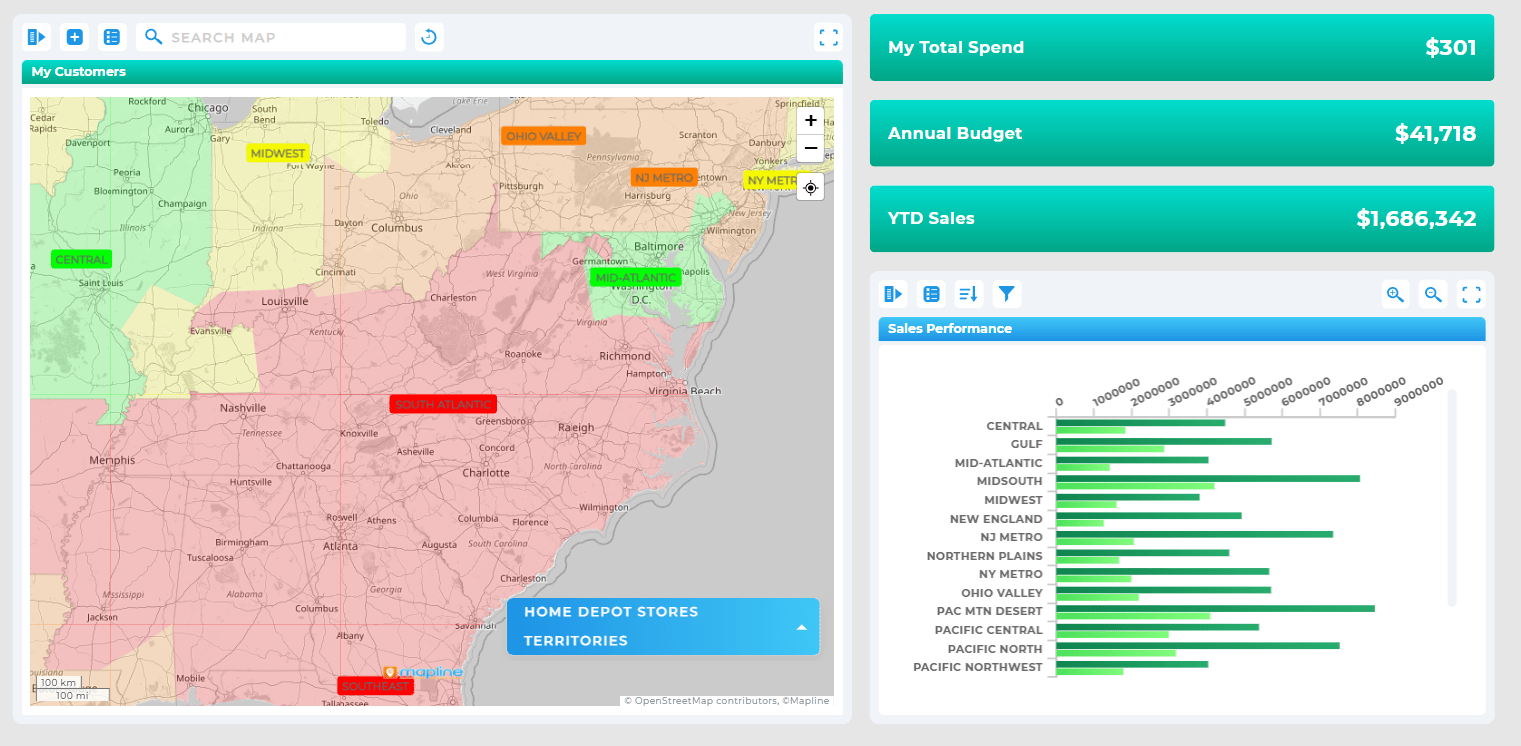
Budget forecasting software should do more than project run rates—it should incorporate seasonality, local demand drivers, and planned territory changes. When forecasts can be sliced by store, region, or delivery zone, leaders can model the impact of staffing moves, promotions, or new site openings. Adding location layers helps explain why two similar stores diverge and where the next dollar of investment should go. Accurate, context-aware projections reduce surprises and keep teams focused on controllable levers. Over time, this discipline compounds into meaningful margin improvement.
Expense Tracking and Cost Allocation That Scales
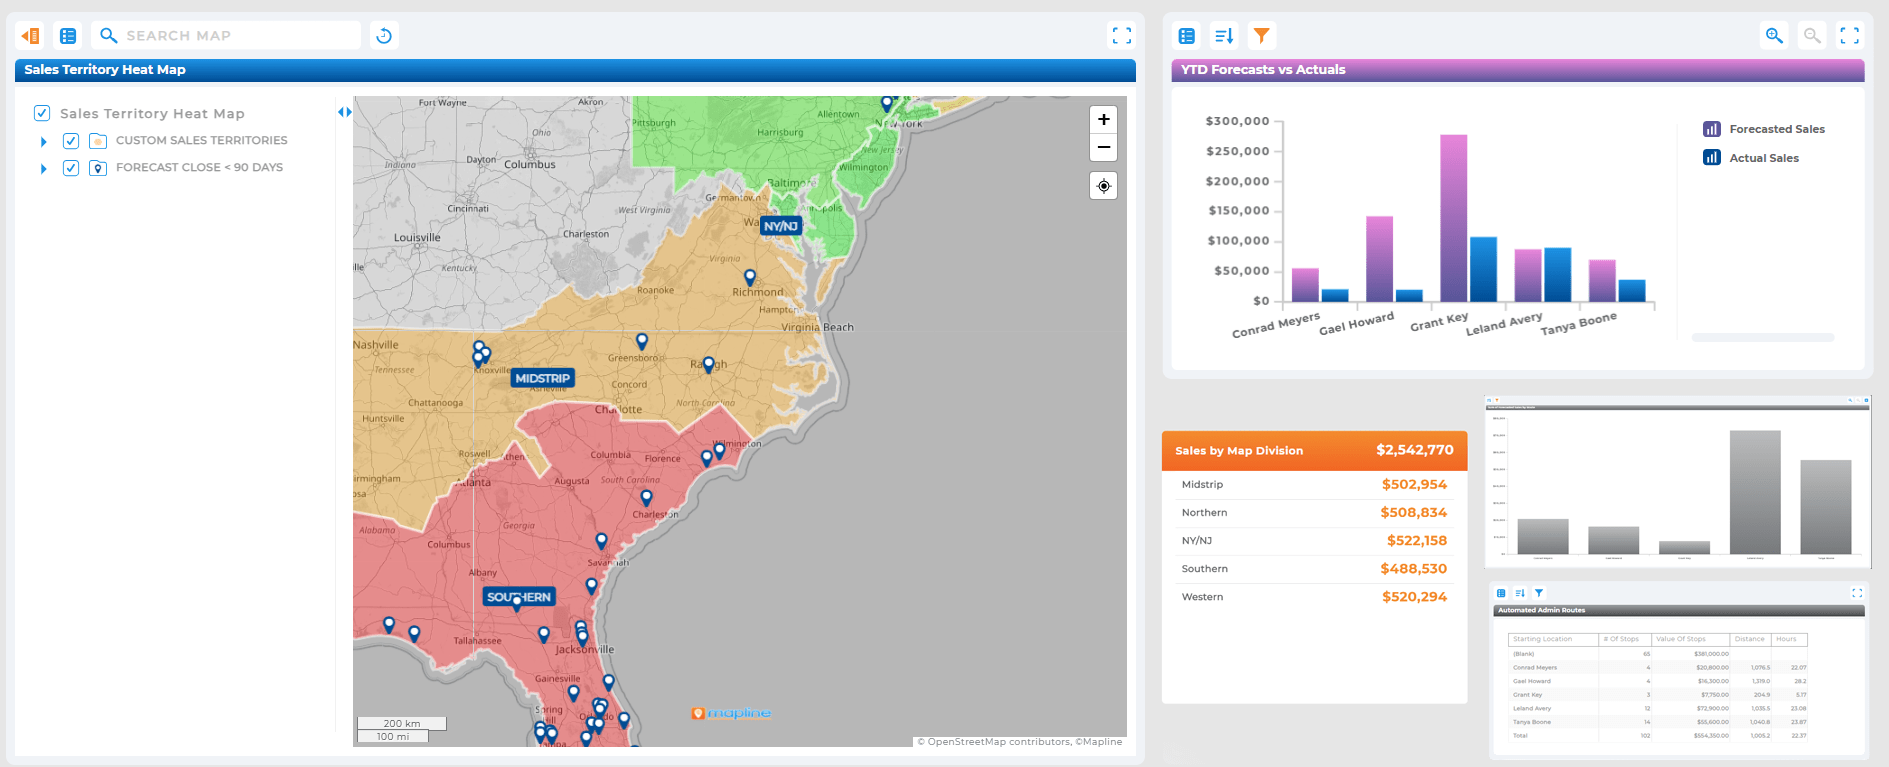
Accurate business expense tracking is essential when overhead spans multiple markets. While a best business expense tracking app can capture receipts and categorize spend, finance still needs reliable allocation to the right store, region, or project. The ideal workflow tags costs at the source and rolls them into financial statement analysis software, preserving audit trails. When expense policies, approvals, and allocations are consistent, benchmarking becomes fair and decisions feel trusted. That trust speeds approvals and reduces the “where did this number come from?” friction that slows teams down.
Why Mapping Belongs in Your Financial Stack
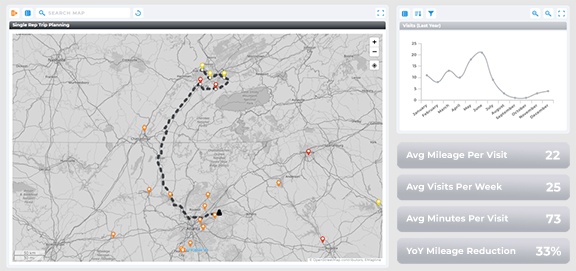
Spreadsheets show what changed—maps reveal where it changed and why. Pairing geo views with financial reporting tools exposes patterns that otherwise stay buried: stores near a new competitor, delivery-heavy territories with creeping overtime, or districts underserved by marketing spend. Seeing margin and revenue heat up or cool down on a map helps leaders prioritize the right interventions. It also makes weekly business reviews far more practical, since teams can point to specific neighborhoods, routes, or trade areas. When finance and geography work together, the conversation moves from abstraction to direction.
Visualize Revenue and Margin by Territory
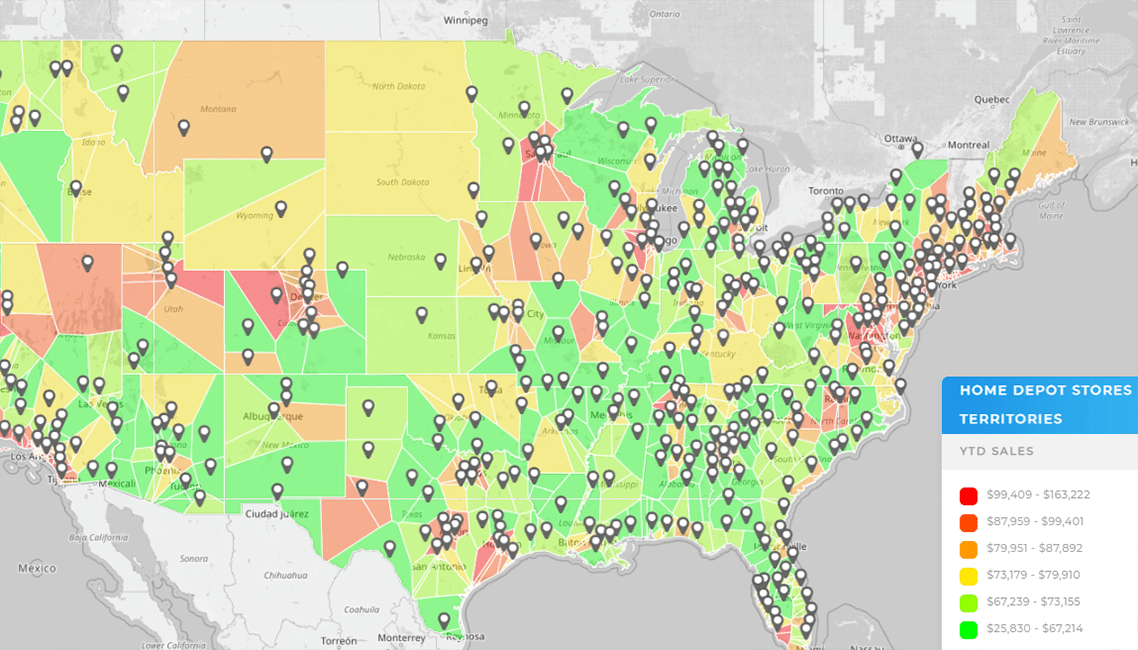
Territory shading helps executives compare contribution and cost drivers across sales or service regions. If one territory consistently beats margin targets while a neighbor lags, a map-first view encourages targeted coaching, staffing adjustments, or promotional tests. It also clarifies how overlapping coverage or unclear ownership erodes performance. Bringing territory context into financial dashboards accelerates the path from insight to action. The clarity builds better habits across the field.
Zip-Code Level Profitability Signals
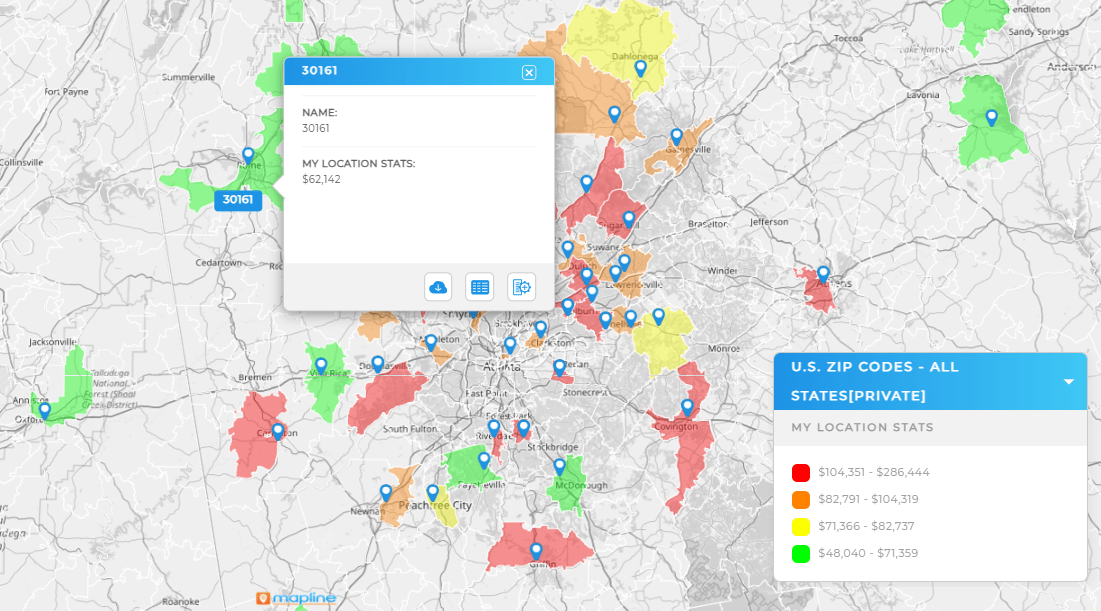
Aggregating financial outcomes to ZIP code or trade area level can surface micro-trends that store averages hide. Leaders can spot pockets of strong demand that justify staffing changes or local campaigns, as well as low-yield zones that need cost control. Linking these views to territory mapping makes it easy to adjust boundaries without breaking reporting. Over time, this granular lens helps maximize each location’s catchment potential. Small, local wins add up to systemwide gains.
Spot Cost Leaks Along Routes and Regions
Delivery surcharges, overtime, and repeat service calls often cluster geographically. A map that overlays financial impacts with route footprints or service zones can reveal exactly where costs creep in. With that context, operators can revisit scheduling, rebalance territories, or tighten SLAs to protect margin. The goal isn’t more visuals; it’s fewer surprises and faster fixes. When geography explains the variance, corrective action becomes straightforward.

How Mapline Complements Your Financial Reporting Tools
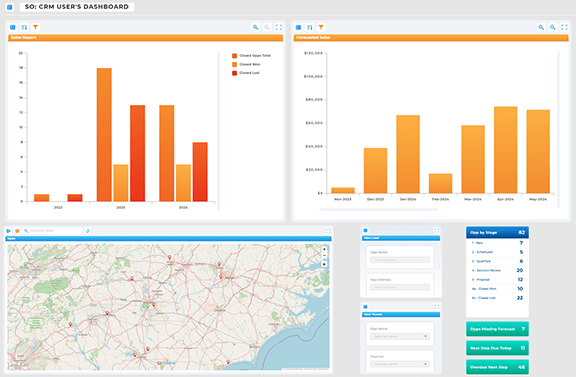
Mapline adds location intelligence to the financial stack you already use. Instead of replacing accounting or BI systems, it connects to the data you trust and brings it to life on interactive maps and territory views. Finance leaders can compare P&L performance across regions, while operators drill into local drivers like service density or delivery zones. Rollouts are fast because the interface is built for everyday users, not specialists. The payoff is a shared, visual language that speeds decision-making across finance, operations, and the field.
Faster Answers for Operators
Store and district leaders don’t have time to parse complex models. With map-first dashboards, they can see where performance deviates and which levers to pull next. Filters for location type, shift, or territory keep the focus tight and actionable. Because the experience is intuitive, adoption spreads without heavy training. More people using the same view leads to better alignment and better results.
Simpler Rollouts for Finance Teams
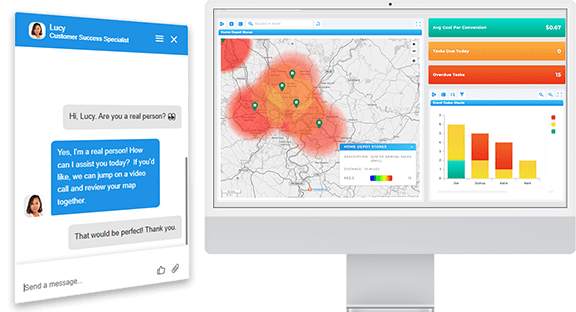
Finance teams need consistency and control without bottlenecking decisions. Mapline’s templates and data governance options help standardize views while still allowing local flexibility. That balance keeps reporting clean and reduces one-off requests that drain capacity. When the tool fits into existing processes, it becomes a force multiplier rather than one more system to maintain. Simplicity is a strategic advantage.
One Source of Truth, Shared Visually
Disagreement about numbers wastes time and erodes trust. Connecting your financial reporting tools to a single, governed dataset and then visualizing results geographically moves the conversation forward. Executives see the enterprise-wide story while local managers recognize their context. This shared truth creates accountability without confrontation. It also makes cross-functional planning faster and more productive.

Implementation Checklist for Multi-Location Finance
A strong solution doesn’t need to be complicated. The fastest wins come from aligning stakeholders, cleaning key data, and choosing a focused set of KPIs to visualize. Start with a pilot that represents a typical region, then expand in waves once templates prove effective. Keep governance lightweight but clear so teams know how fields, accounts, and territories should be tagged. With that foundation, the stack scales smoothly as your footprint grows.
- Confirm the single source of truth for revenue, COGS, labor, and overhead.
- Standardize chart of accounts and location IDs across stores and regions.
- Define five to seven financial KPIs for your first dashboards by territory.
- Integrate expense tracking to tag costs at the store or region level.
- Connect mapping to your BI outputs to visualize trends by geography.
- Pilot with one district, document lessons, and templatize for rollout.
BI Dashboards vs. Spreadsheets for Multi-Location Finance
Spreadsheets are great for ad hoc analysis and one-off models, but they struggle to keep pace with multi-location operations. Version control issues, inconsistent formulas, and manual updates slow the business down. Financial reporting tools and BI dashboards provide governed, real-time views everyone can trust. They also make it easy to drill from enterprise totals to location-level drivers without duplicating effort. When your footprint expands, the difference between manual and managed reporting shows up as time, trust, and margin.
Financial reporting tools consolidate and visualize financial data—like revenue, expenses, and margin—so leaders can analyze performance and make informed decisions.
They provide both roll-up and location-level views, making it easier to benchmark stores, spot outliers, and act on regional trends that affect profitability.
No—Mapline complements your existing stack by adding location intelligence and territory views to the financial outputs you already trust.
Use business expense tracking tools that tag costs with store or region IDs, then feed those records into your financial statement analysis software for accurate allocation.
Start with revenue, gross margin, labor percent, inventory turns, contribution by location, and a short list of controllable expense ratios.
Mapping shows where performance changes, revealing patterns tied to territories, trade areas, delivery zones, or competitor proximity so you can intervene precisely.
Standardize your chart of accounts and location tags, choose a handful of KPIs, and pilot a dashboard plus map view for one region before rolling out broadly.


