- Blog
- Geo Mapping
- How to Make a Zip Code Heat Map in 3 Easy Steps
If you’re looking to create a zip code heat map, you probably want a fast, visual way to analyze data by geographic region. Whether you’re visualizing customer concentration, sales performance, service areas, or ad campaign impact, a zip code heat map gives you the clarity you need to make location-based decisions.
While many platforms claim to offer heat maps, Mapline makes it easy to create a heat map with zip codes in just a few clicks. No coding. No shapefiles. No GIS background required.
Create A Heat Map Based On Zip Codes
If you’re trying to build an Excel heat map zip code visual, you’re probably running into limitations. While Excel is great for spreadsheets, it’s not built for mapping. You might get a static chart, but you’re stuck with manual formatting, inaccurate boundaries, and no interactivity.
Mapline solves all of that. With Mapline, you can:
- Automatically pull in accurate zip code boundaries
- Style those boundaries with dynamic color based on your data
- Instantly visualize trends, gaps, or performance by territory
- Update data without rebuilding your entire visual
In other words, you get a real heat map based on zip codes that’s interactive, fast, and built for business insights.
Step 1: Import Your Data to Create A Heat Map With Zip Codes
If you’re starting from a spreadsheet, you can create an Excel heat map by zip code in minutes using Mapline.
To get started, configure your Excel file with a column that contains ZIP codes and any relevant data you want to analyze—like sales numbers, service status, or customer count. Or skip the file altogether and use an existing Mapline dataset.
Once you’re ready:
- From the Mapline home page, click ADD NEW ITEMS > NEW MAP
- Name your map and click OK
- From the map menubar, click ADD > PINS > FROM SPREADSHEET (or from an existing dataset)
- Your pins will appear instantly as soon as your data is uploaded

Pro Tip: Need fast, accurate maps with real territory boundaries? Mapline lets you generate maps with ZIP codes, counties, or custom regions in seconds—no shapefiles or GIS tools required. Just choose your territory, upload your data, and go.
Step 2: Add Zip Codes To Your Map
To enhance your Excel heat map by zip code, you’ll want to overlay accurate zip code boundaries onto your map. Here’s how:
- In your map menubar, click ADD > TERRITORIES > FROM MAPLINE’S REPOSITORY
- Select your desired territory type (e.g., U.S. Zip Codes)
- Choose your fill color and boundary style from the dropdown menus
Step 3: Create Your Zip Code Heat Map
A true zip code heat map generator doesn’t just display data—it reveals insights. With Mapline, you’re not locked into static visuals or complicated setup processes. Instead, you can:
- Add unlimited locations to your map
- Overlay real zip code boundaries
- Style those boundaries dynamically based on your data
Other platforms offer limited styling or require complex shapefiles. Mapline gives you all the power of GIS without the learning curve—perfect for sales teams, operations leaders, marketers, and analysts alike.
To make this happen and build a true zip code heat map from your Excel data, the next step is attaching your data to each territory. Here’s how it works.
Map Location Data To Zip Code Boundaries
Every time you create a new territory layer in Mapline—like U.S. zip codes—a corresponding dataset is created behind the scenes. In this step, you’ll use that dataset to add key metrics like customer count, sales, or store performance to each zip code.
You can do this automatically with Mapline Data calculations, which let you pull in values from your existing location dataset and apply them to your territories in just a few clicks. To add Mapline Data, simply click your zip codes layer in your map sidebar and click MAPLINE DATA. Configure your calculation here, then click OK.
Or, if you prefer, you can copy and paste data manually—just make sure it aligns with your existing pins or zip code names. To access your territory dataset, click the zip code layer in your map sidebar and select VIEW DATA.
Adding data to the territory layer itself allows each territory to “inherit” the data tied to your pins—so you can analyze trends, filter your map, and build a truly dynamic heat map based on the values that matter most.
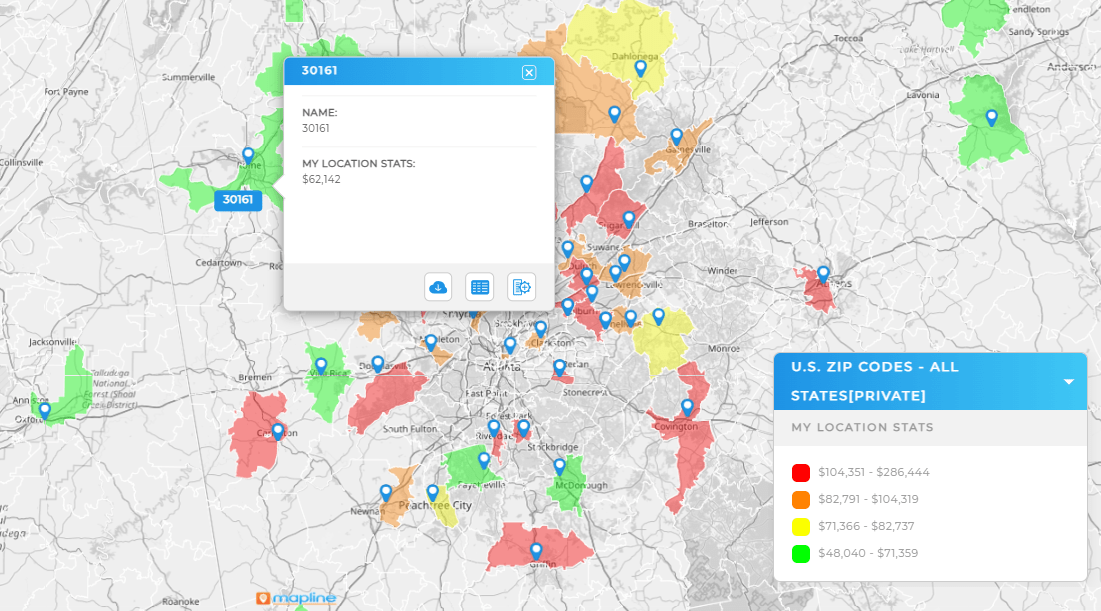
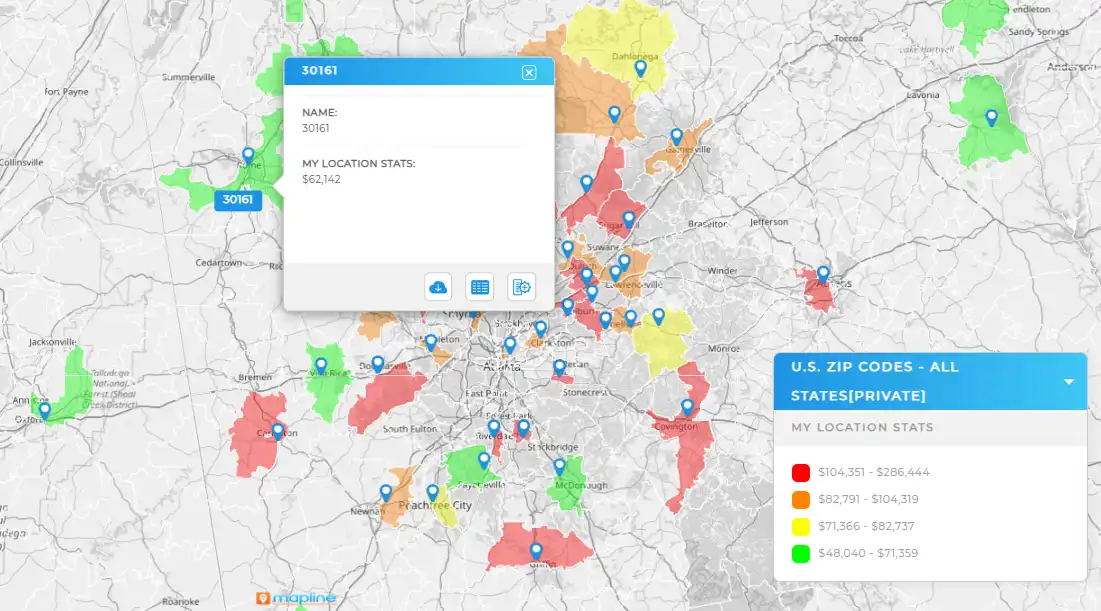
Create heat map from zip codes
Now it’s time to bring it all to life! You can easily style your zip code boundaries to reflect metrics such as:
- Sales volume
- Customer status
- Whether a region is serviceable
- Population density
- Store traffic
- Ad campaign performance
- Or any other column in your dataset
Mapline’s dynamic territory styling empowers you to color-code your territories based on relevant data. To access dynamic styling, click the territory layer in your map sidebar and select STYLE.
When you create heat maps from zip codes, you’re turning raw data into real insight. And in Mapline, you can update those visuals anytime—no need to re-import or reconfigure your map.
See What Your Zip Code Heat Map Unlocks
And that’s it! You just made a dynamic, interactive heat map from zip codes and Excel data. But your zip code heat map is more than just a visual—it’s a launchpad for smarter decisions.
With Mapline, you can turn raw location data into strategy. Track sales by territory, identify underserved regions, or compare performance across markets—all in real time. Whether you’re managing field teams, planning marketing campaigns, or optimizing coverage areas, your heat map gives you the insight to move with confidence.
And that’s just the beginning. With Mapline, you can:
- Generate Territory Reports: Export metrics by region with a click
- Create Dashboards: Combine your heat map with charts, KPIs, and filters
- Use Mapline Data: Enrich your map with census data, demographic data, or business data
- Optimize Sales or Service Areas: Use your visuals to balance workload, prioritize leads, or reassign territories
— no credit card, no downloads, just instant insight.