Data is only valuable if it leads to action. Many organizations invest in business intelligence tools, but too often dashboards become static reports that no one uses. The difference between insight and accountability lies in design — and that’s where interactive dashboards shine. By making data dynamic, accessible, and actionable, companies can transform the way teams operate. With the right approach, dashboards don’t just track performance; they motivate teams, align priorities, and create measurable accountability across every level of the business.
What Are Interactive Dashboards?
Interactive dashboards are visual tools that allow users to explore and manipulate data in real time. Unlike static charts or reports, they provide drill-down capabilities, filters, and dynamic updates that put insights at a team’s fingertips. Whether reviewing KPIs, project progress, or market performance, these dashboards create a shared source of truth. By combining business intelligence dashboards with intuitive controls, organizations ensure data is not just viewed — it’s acted upon. This is why the best teams rely on dashboards to drive strategy, monitor performance, and stay accountable.


Pro Tip: Use Mapline’s Geo BI product to build interactive dashboards that update in real time. By connecting sales, operations, and project data in one place, you’ll create a culture of transparency and accountability.
Why Interactive Dashboards Improve Accountability
Accountability requires clarity, transparency, and real-time feedback. Traditional reports often fail because they arrive too late or are too rigid to answer evolving questions. Real time interactive dashboards solve this problem by ensuring everyone has immediate visibility into performance metrics. Teams can see exactly where they stand, compare results across departments, and course-correct before small issues become big problems. When data is transparent and accessible, accountability stops being a buzzword and becomes part of daily operations.
Key Types of Dashboards for Accountability
Different business functions require different types of dashboards, each designed to answer specific questions and track critical metrics. Sales teams may need dashboards that highlight pipeline health and territory performance, while operations teams focus on efficiency, delivery times, and resource utilization. Executives often require high-level dashboards that bring together KPIs across departments for a holistic view of performance. A well-rounded strategy incorporates multiple views tailored to roles and goals, ensuring every team has the insights they need to stay aligned. By implementing diverse BI dashboard examples, organizations strengthen accountability, encourage data-driven decision-making, and create transparency across the business. Ultimately, the right mix of dashboards keeps performance visible and teams focused on shared outcomes.
Project Management Dashboards
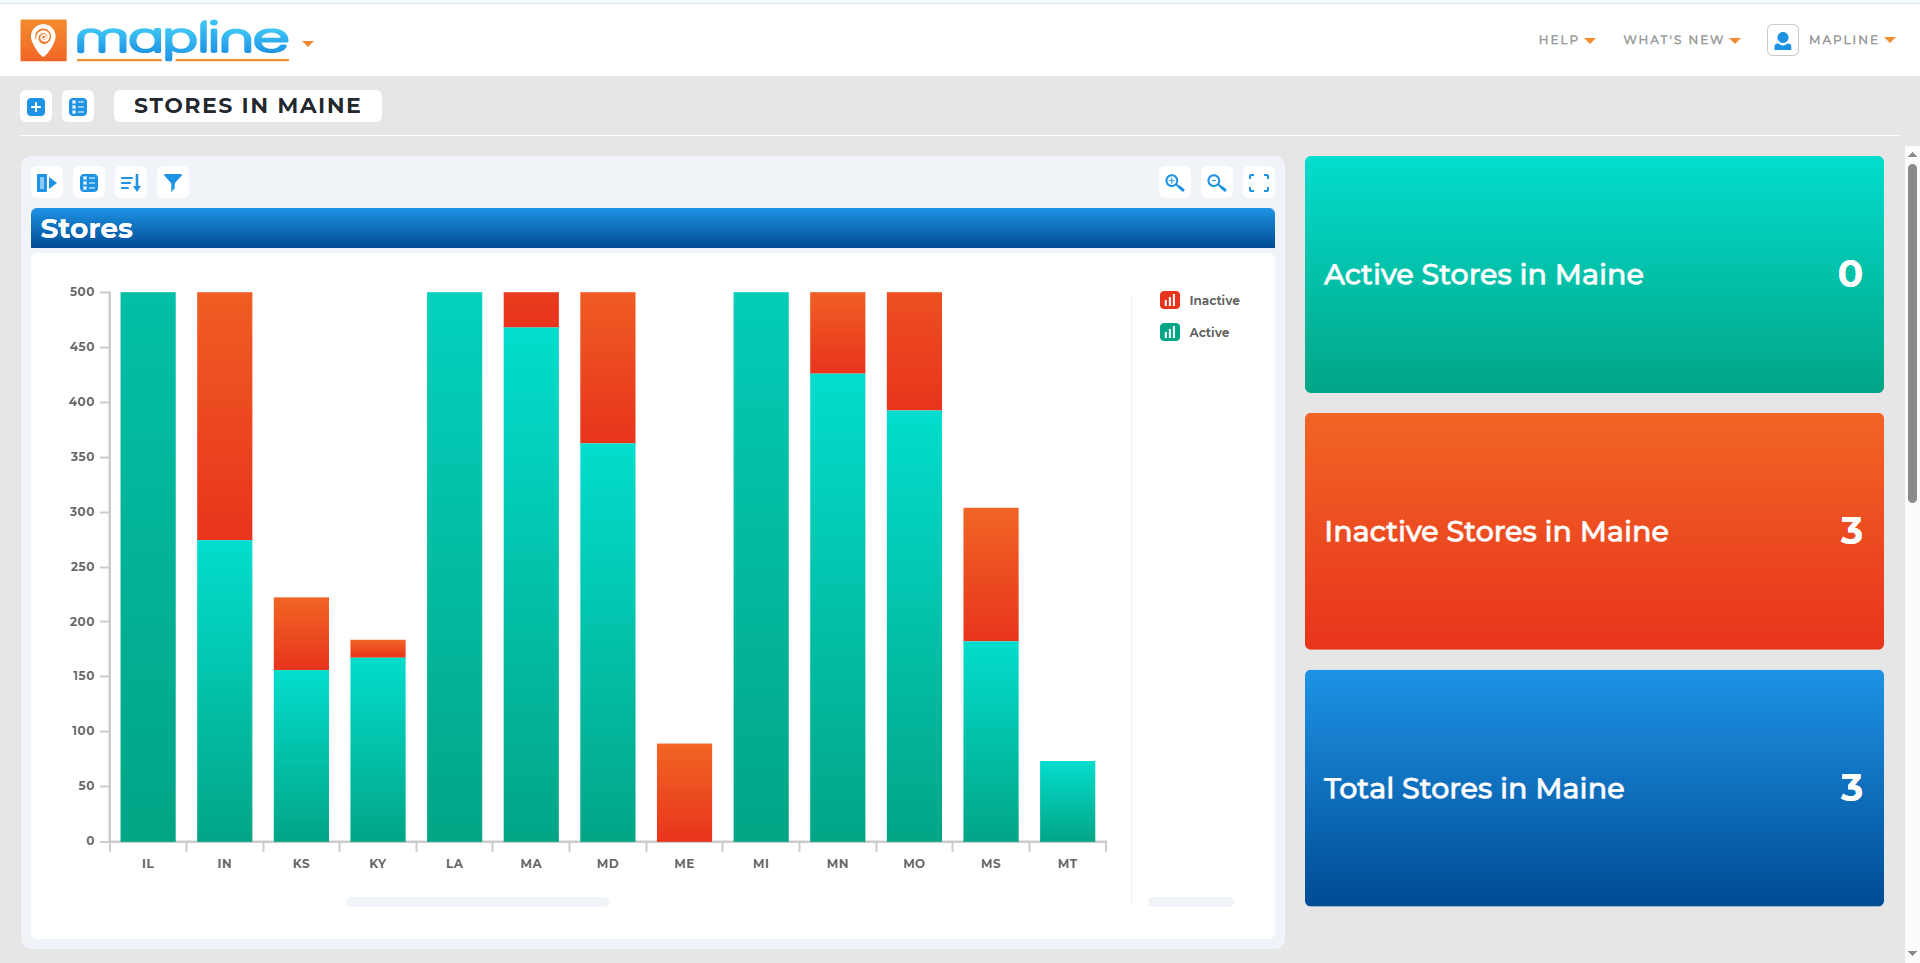
A project management dashboard tracks timelines, milestones, and dependencies in one place. Teams can quickly see which projects are on track, which are at risk, and who is responsible for each task. This visibility reduces delays and ensures accountability is shared across project stakeholders.

Task Management Dashboards
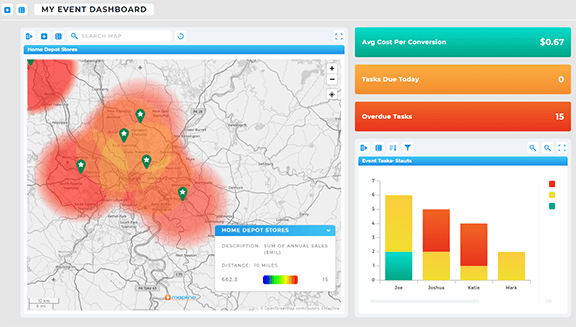
Task-level visibility is critical for daily accountability. With a task management dashboard, leaders can monitor individual workloads, check progress, and balance assignments. Employees benefit from clarity around priorities, while managers gain confidence that work is distributed effectively.

Employee Performance Dashboards
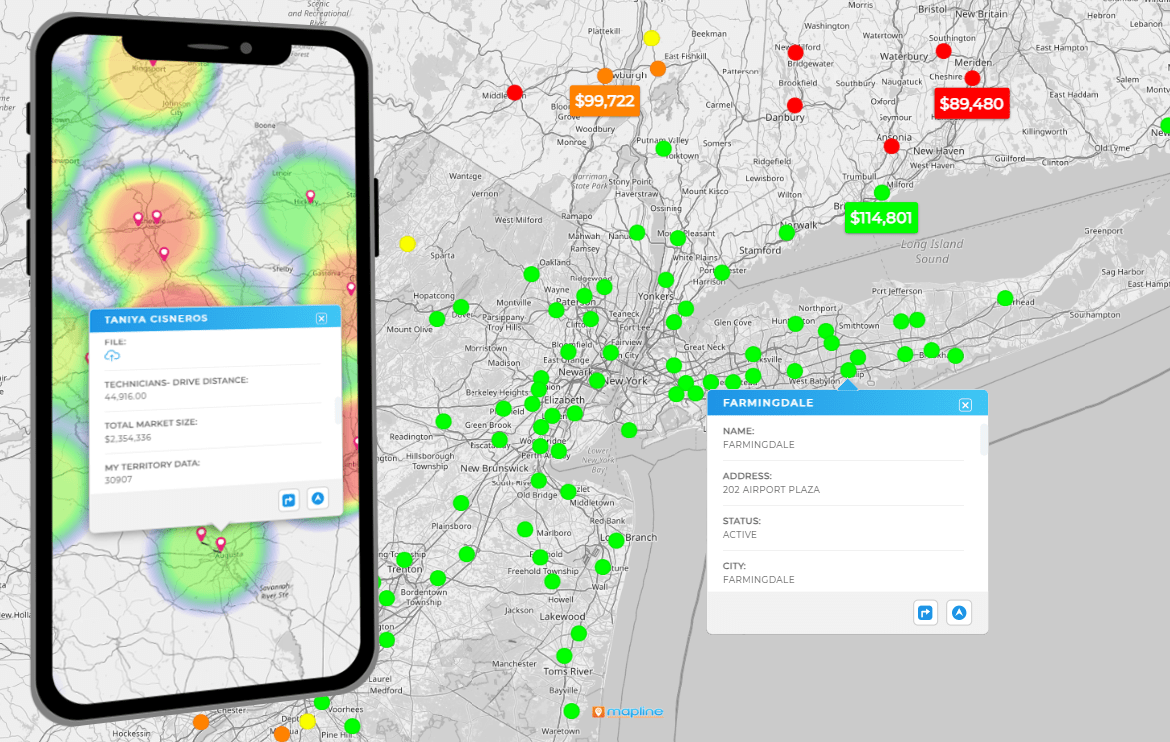
Holding teams accountable requires measuring outcomes, not just activities. Employee performance dashboards show productivity, goal attainment, and quality metrics in real time. These insights make it easier to recognize top performers, provide targeted coaching, and keep everyone aligned with organizational goals.

Competitive Intelligence Dashboards
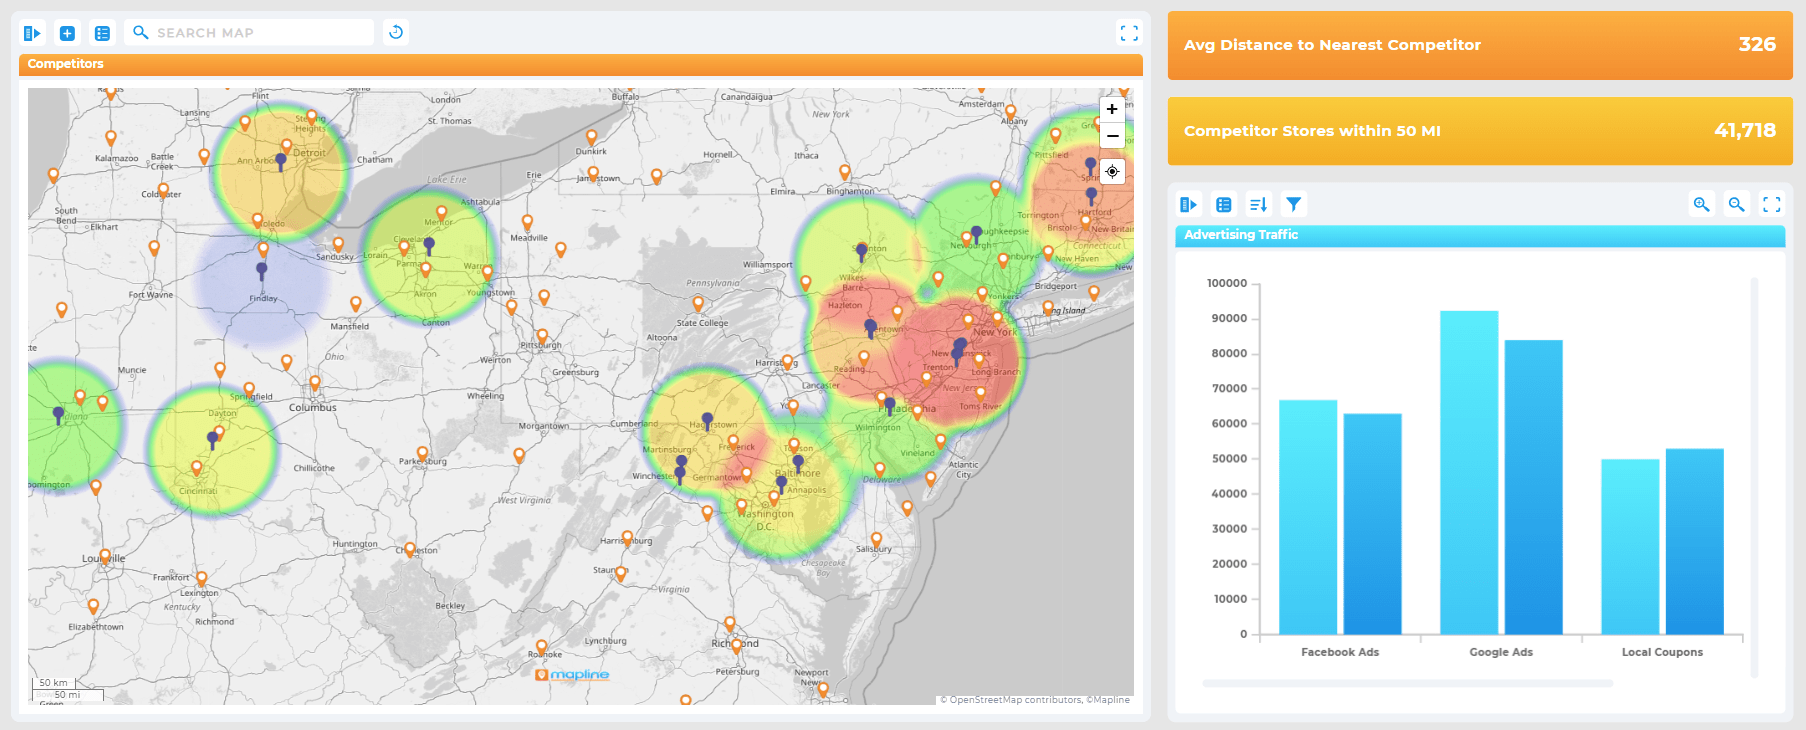
Accountability isn’t only internal — it’s also about staying competitive in the marketplace. A competitive intelligence dashboard highlights market performance, competitor activity, and benchmark comparisons. By monitoring these metrics, organizations can hold themselves accountable to market standards and adjust strategies quickly.

The Best BI Dashboard Tools
When it comes to choosing the right platform, businesses often weigh options like Mapline, Tableau, or Power BI. A Power BI dashboard is powerful but may require technical expertise to set up and maintain. Mapline simplifies the process, delivering interactive dashboards without steep learning curves or heavy IT resources. Compared to other best BI dashboard tools, Mapline emphasizes accessibility while still offering enterprise-grade performance. This ensures teams can act on data immediately, making accountability a built-in feature rather than an afterthought.
They are dynamic data tools that allow users to filter, drill down, and interact with metrics in real time.
They make data transparent and actionable, ensuring teams see performance metrics immediately and respond faster.
Project management, task management, employee performance, and competitive intelligence dashboards are the most impactful for accountability.
Yes, but they often require technical setup. Mapline provides easier-to-use business intelligence dashboards for faster adoption.
Clear metrics, real-time updates, and intuitive design ensure dashboards become tools for accountability, not just reports.
They track productivity, outcomes, and goal progress, making it easier to recognize achievements and improve performance.
Yes. Mapline complements systems like Power BI or Tableau, adding accessible geo business intelligence features.
All industries — from logistics to healthcare — benefit when data visibility and accountability are improved.


