MAPLINEvsTABLEAU

Not all BI software is created equal. If you’re looking for a solution that not only visualizes your data but also powers your business with analytics, workflows, and advanced tools, you’re in the right place. Let’s dive into how Mapline and Tableau stack up. While both platforms offer basic BI features, only Mapline delivers advanced geospatial analytics, automated workflows, and end-to-end business solutions.
Both Mapline and Tableau help organizations visualize data, but they serve very different purposes. Tableau is a data visualization tool that’s often held back by its complexity, high cost, and limited geospatial and operational capabilities.
Mapline, on the other hand, is a user-friendly software built specifically to connect data with geography, combining robust analytics with intuitive visualizations that anyone can use. It doesn’t just display maps and charts—it ties data directly to locations, automates workflows, and reveals actionable insights that drive growth. For brands that need speed, clarity, and geospatial intelligence without the steep learning curve, Mapline delivers a streamlined alternative that turns raw data into strategy faster than Tableau ever could.
In short, Tableau is a great BI dashboard tool, but Mapline transforms data into operational intelligence, bridging the gap between analysis and execution.

WHAT DOES MAPLINE DO?
Mapline is a geospatial analytics and business intelligence platform designed to make data instantly actionable. With tools for mapping, territory management, routing, and scheduling, it empowers teams to connect their data directly to geography and uncover insights that drive measurable results. Users can create interactive maps, visualize sales or customer trends, and automate workflows without needing technical expertise.
Because it’s built for speed and usability, teams across sales, operations, and logistics can make smarter decisions in real time. By bridging analytics with execution, Mapline turns complex business data into strategies that reduce costs, improve performance, and accelerate growth.

WHAT DOES TABLEAU DO?
Tableau is a business intelligence platform focused on advanced data visualization and reporting. It allows analysts and data teams to create interactive dashboards, charts, and graphs that highlight trends across large datasets. While Tableau offers some geographic mapping, its strength lies in general-purpose data exploration rather than geospatial intelligence or operational management.
Because of its complexity, many organizations require specialized training or IT support to fully implement and scale it. For companies with dedicated analysts, Tableau provides deep insights, but its limitations in ease of use, routing, and real-time operational tools can make it less accessible for everyday business teams.

Demographic Data
Mapline: Enriches your data with built-in demographics (population, income, households, age, and more) to instantly reveal high-potential markets.
Tableau: Can display demographics if you import them, but offers no built-in datasets or geo-enrichment capabilities.

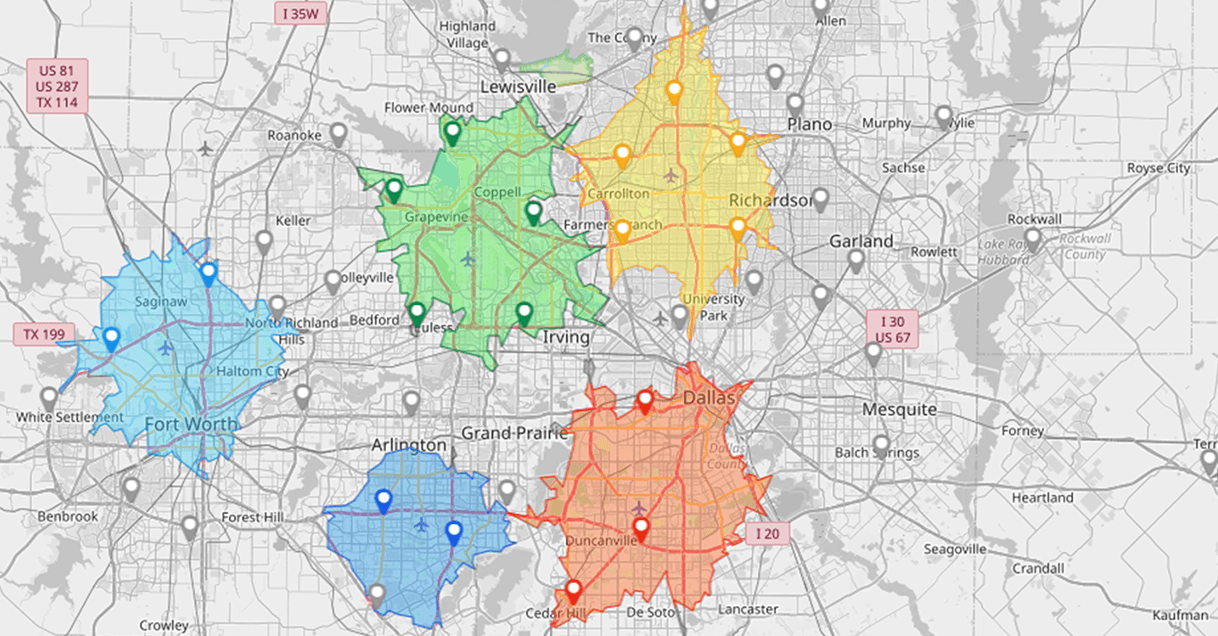
Market & Territory Analysis
Mapline: Automates territory creation, alignment, and reporting so you can measure market potential and team performance at scale.
Tableau: Provides regional visualizations but lacks automated territory design, balancing, or optimization tools.

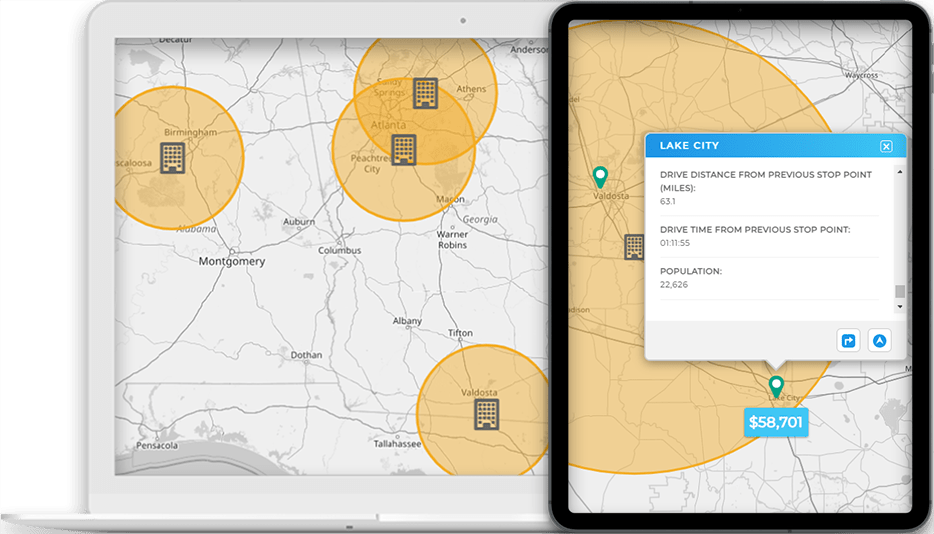
Drive-Time & Distance
Mapline: Instantly calculates real-world drive times and distance-based coverage zones, making it easy to plan efficient service areas.
Tableau: Offers static geographic visuals but no advanced drive-time, distance, or routing analysis.

Coverage Gap Identification
Mapline: Overlays customer clusters, sales, and territories to reveal underserved areas or regions at risk of churn.
Tableau: Visuals can show density, but it lacks automated gap detection or territory comparison tools.

Competitor Mapping
Mapline: Plots competitor locations alongside your own data to highlight overlaps, blind spots, and whitespace opportunities.
Tableau: Requires manual setup with imported competitor data and doesn’t include specialized competitor analysis features.

Location-Based Targeting
Mapline: Filters and segments prospects or customers by geography, demographics, or performance metrics for precise targeting.
Tableau: Can filter geographically, but lacks location-based targeting or segmentation tied to real-world business actions.

Automated Geo Communications
Mapline: Triggers automated campaigns and workflows based on location or conditions (e.g., weather-based promotions, hyper-local alerts).
Tableau: Provides dashboards only — no built-in communications, triggers, or workflow automation.

Campaign Analytics
Mapline: Ties marketing and sales results directly to geography so you can measure campaign impact by territory or region.
Tableau: Displays campaign KPIs but doesn’t provide geographic campaign analysis or tie insights back to territories.

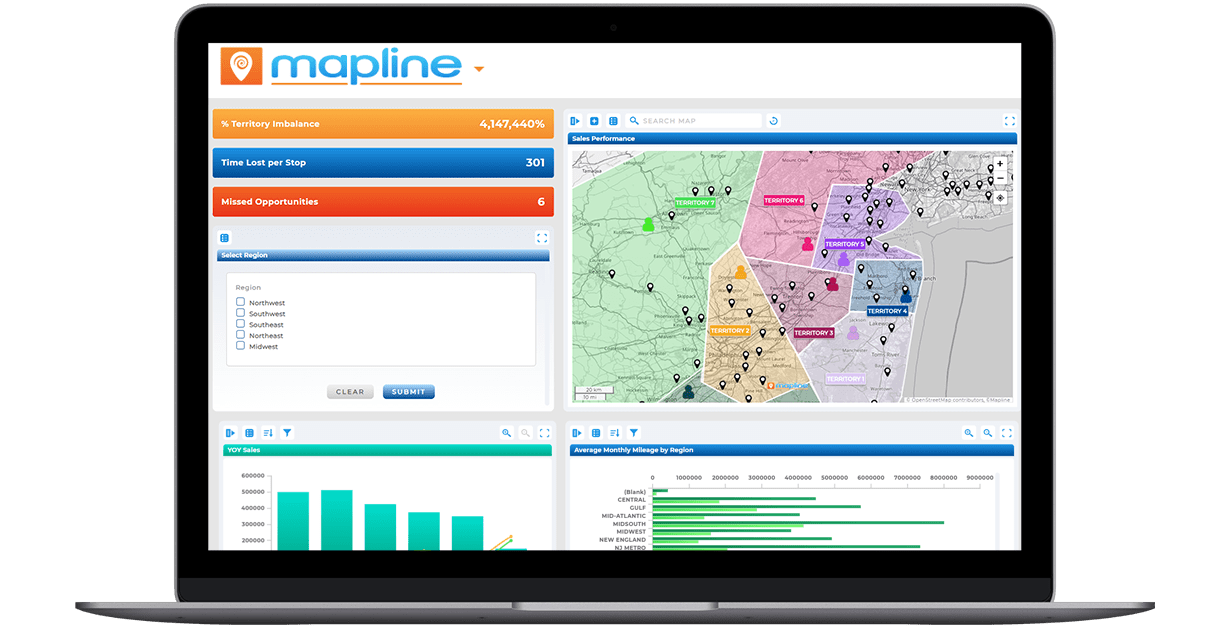
Interactive Geo Dashboards
Mapline: Builds dashboards where KPIs are mapped to regions, territories, and boundaries for real-time decision support.
Tableau: Delivers interactive dashboards, but geographic layers are limited to basic maps and heat maps.

Multi-Dataset Correlation
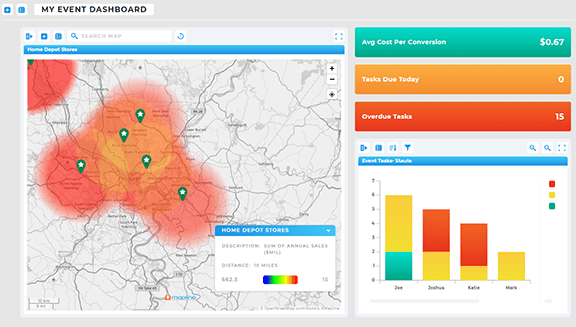
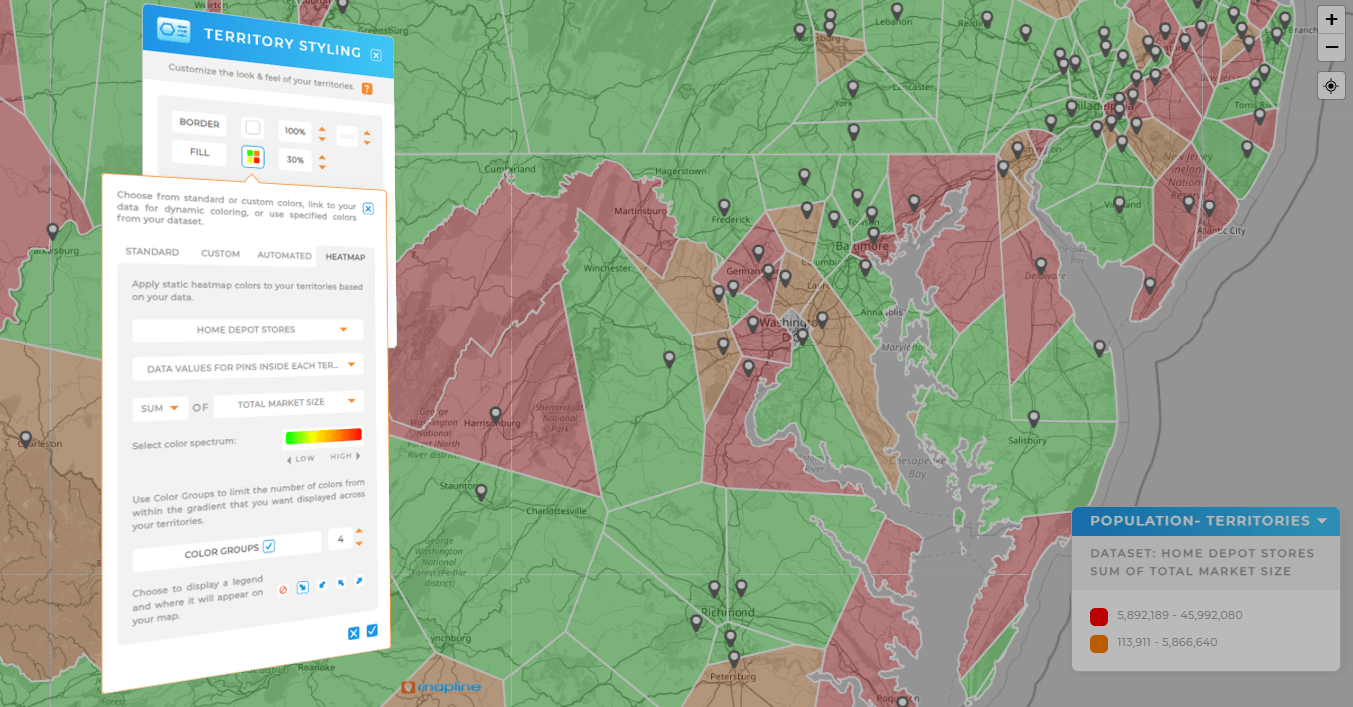
Mapline: Combines customer, sales, competitor, demographic, and operational datasets into a single map for deeper insights.
Tableau: Allows multiple data sources but struggles with true geographic layering and spatial correlation across datasets.

Heat Maps
Mapline: Creates dynamic heat maps at the zip code, territory, or custom-shape level, instantly highlighting hot spots.
Tableau: Supports heat maps, but customization is limited and it lacks advanced zip-code-level visualization tools.

Territory Reporting
Mapline: Produces real-time, geography-driven reports across hundreds of territories to give managers actionable visibility.
Tableau: Can generate regional reports, but lacks built-in territory management and scalable territory reporting.
Feature | Mapline | Tableau |
---|---|---|
Charts & reports | ✓ | ✓ |
Competitor mapping & market analysis | ✓ | ✓ |
Heat maps | ✓ | ✓ Super limited functionality |
KPI tracking dashboards | ✓ | ✓ |
Market expansion analysis | ✓ | ✓ |
Multi-dataset analytics | ✓ | ✓ |
Trend & forecast analysis | ✓ | ✓ |
API & Integrations | ✓ | ✓ Heavier technical setup |
Data sharing & embedding | ✓ | ✓ Often static/licensed |
Coverage gap identification | ✓ | ✖ |
Custom map styling | ✓ | ✖ Limited customization |
Custom territory creation | ✓ | ✖ Manual only |
Demographic data overlays | ✓ Built-in demographics | ✖ Import required |
Drive time & distance analysis | ✓ | ✖ |
Gov & admin boundaries | ✓ | ✖ Limited coverage |
Location-based targeting | ✓ | ✖ |
Territory performance reporting | ✓ | ✖ |
Automated data entry & intake | ✓ | ✖ |
Automated location-based email + text | ✓ Built-in automation for geo-targeted campaigns | ✖ No native email/text or geo-targeting |
Choosing the right business intelligence software isn’t just about dashboards: it’s about empowering your team with actionable insights that translate directly into growth. The most effective BI platforms go beyond static reports, delivering dynamic, interactive tools that help companies see opportunities before competitors do.
Smart BI software bridges the gap between raw data and decision-making, uncovering patterns that fuel faster, more confident strategies. When evaluating BI platforms, leaders should look for features that not only visualize data, but also tie it directly to operations, customers, and market conditions. Here are some of the most impactful capabilities to prioritize when searching for the right solution.
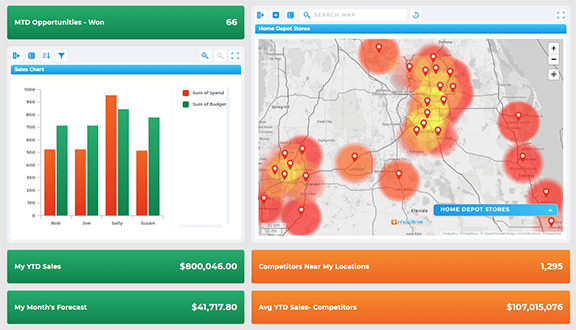
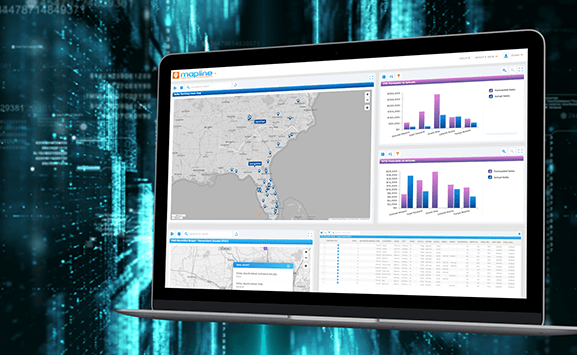
Stunning Maps and Geospatial Insights
Visualizing data on a map turns abstract numbers into real-world context. With geospatial analytics, companies can track customer density, sales territories, or coverage areas in seconds. This perspective makes it easier to spot opportunities, identify gaps, and understand performance in a way spreadsheets simply can’t.

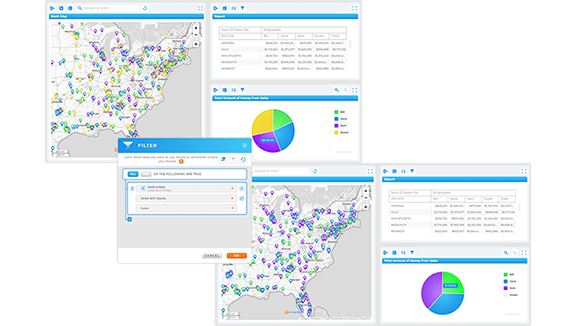
Custom Territories and Performance Reporting
Territory management is the backbone of efficient field operations. BI software that allows territory creation and automated performance reporting ensures resources are distributed fairly and effectively. By tracking performance across regions, businesses can quickly adjust strategies to maximize productivity and profitability.

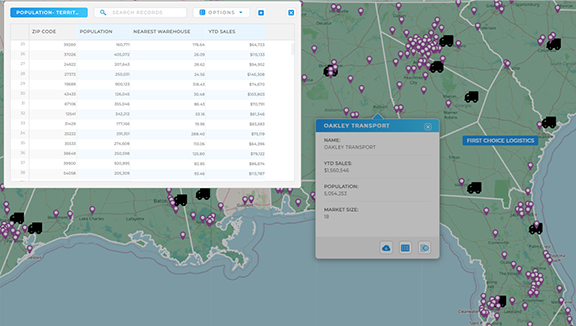
Demographic and Market Data Overlays
Built-in demographic and market overlays supercharge business analysis. Instead of relying on raw numbers alone, leaders can segment by household income, age groups, or population density to identify growth-ready markets. Adding this layer of context makes campaigns more targeted and market expansion more precise.

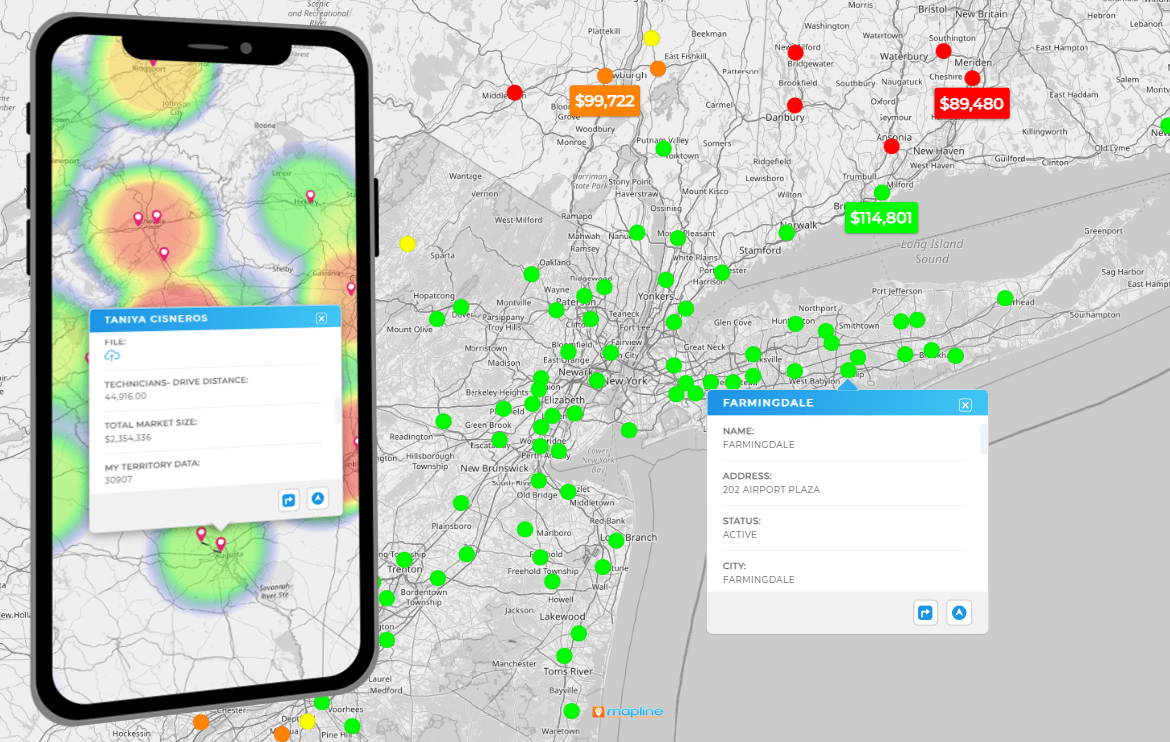
Drive-Time and Distance Analysis
Location intelligence takes on new power when paired with drive-time and distance analytics. Businesses can instantly calculate travel efficiency, minimize costs, and improve customer service by ensuring teams are always in the right place at the right time. These insights directly translate into reduced expenses and optimized operations.

Audience Segmentation and Targeting
Great BI tools don’t just collect data—they slice it in ways that reveal hidden patterns. Audience segmentation helps businesses refine campaigns, tailor offerings, and engage with the right people at the right moment. By understanding where specific customer groups exist, brands can create targeted strategies that resonate more deeply.

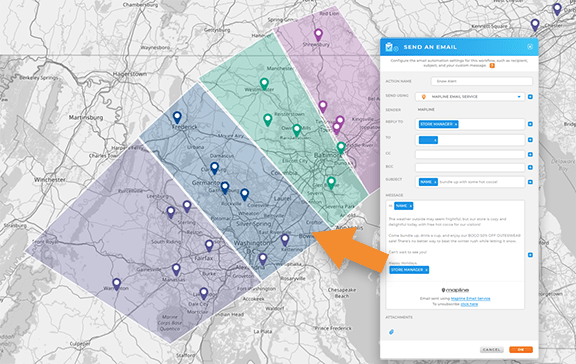
Automated Alerts and Communications
Smart BI platforms connect data with action. Automated communications based on location, events, or performance keep teams and customers informed without manual effort. This capability ensures organizations respond in real time, whether that’s alerting staff about a service delay or engaging customers with timely, relevant offers.

SEAMLESS INTEGRATION
Your data is far more powerful when your systems can communicate with each other. Many mapping tools offer an API, but you need something that’s custom-built to your needs.
Mapline’s connectors empower you to integrate wtih any other program or system, even if you’re not tech-savvy. This way, your data can update in real-time through other programs like Salesforce, Hubspot, [any others? routing?], giving you full visibility into your operations and team movements.

UNPARALLELED CUSTOMER SUPPORT
Kick the bots and talk to a real human! Many mapping tools like Maptive have limited customer support, or rely on chat bots to support customers.
With Mapline, you’ll talk to humans who don’t mind answering questions and walking you through things step-by-step. If you’re not tech-savvy, Mapline is definitely for you! Not only is our software inutitive and user-friendly, but our team is dedicated to helping you get the exact results you need, and we won’t rest until it’s done.

Don’t just take our word for it:


- “Mapline is critical in the success of our company, because it allows us to play matchmaker between sales and operations.”– Ashley Weitman, COO, Elevo
- “I’m not a spreadsheet person, so Mapline literally saved my life. It’s so easy to miss stuff with letters and numbers, but then when you see colors, you recognize the gaps instantly and are able to investigate new areas where we can be making money!”– Lydia Rogers, Digital Solutions, Greenworks Commercial
- “Between manager, supervisors, directors and even higher levels than that, each want to know different, specific information. Mapline dashboards enable me to A La Carte for each palate, all the while making me look like a genius! It is my work endorphin. It’s so gratifying, honestly.”– Lydia Rogers, Digital Solutions, Greenworks Commercial
- “I have been using Mapline’s software for the past three months to optimize our delivery zones and visualize customer activity on a map. The insights gained have been invaluable to our delivery operations.”– Josh Chang, Head of Operations, Buncha
- “Just being able to gather, pull, and map data, all within minutes. You wanna talk about a time-saver? Which is also money-saving!”– Lydia Rogers, Digital Solutions, Greenworks Commercial
- “Mapline is incredibly valuable to the business. Quite literally, mapping out [the] opportunities we can easily tap into with the existing resources that we have.”– Kat Hackett, Dir of Sales, Elevo
- “What truly sets Mapline apart is the exceptional quality of their customer service and account management. Among the 40+ SaaS tools my business relies on, Mapline consistently stands out.”– Josh Chang, Head of Operations, Buncha
- “Our company has tapped into a vein of gold with Mapline, and I am just really thankful. I wish all of my business dealings throughout the day were like Mapline.”– Lydia Rogers, Digital Solutions, Greenworks Commercial
- “With Mapline, we’re able to visualize everything on a larger scale so that we can really pinpoint those areas that might be a good target for us. Mapline is really going benefit our relationships with customers and hospitals.”– Erica Swigart, Sr. Manager, Atricure
- “Above all, the Mapline team has been a breath of fresh air to work with. I have had to sit through many trainings the past 6 months due to growth in our business. But none makes me as excited as when I open my calendar and see an upcoming training or meeting with the Mapline clan.”– Lydia Rogers, Digital Solutions, Greenworks Commercial
- “Historically, it’s all been done in spreadsheets. It was a nightmare [keeping track]. Now, we can get in front of it and say, ‘Here’s the green zone, go sell like crazy!’ Or, ‘Here’s the yellow zone, set proper expectations with your customers.'”– Kat Hackett, Dir of Sales, Elevo
- “Thank you Mapline for such an AMAZING program that is saving us money and building confidence in our future growth!”– Lydia Rogers, Digital Solutions, Greenworks Commercial
- “Above all, the Mapline team has been a breath of fresh air to work with. I have had to sit through many trainings the past 6 months due to growth in our business. But none makes me as excited as when I open my calendar and see an upcoming training or meeting with the Mapline clan.”– Lydia Rogers, Greenworks Commercial
- “Thank you Mapline for such an AMAZING program that is saving us money and building confidence in our future growth!”– Lydia Rogers, Greenworks Commercial

When comparing BI platforms, it becomes clear that not all solutions are created equal. Tableau delivers strong general-purpose data visualization, but it often requires steep technical expertise, extensive setup, and third-party add-ons for geospatial analysis.
Mapline, by contrast, integrates mapping, analytics, and operational tools into one seamless platform, making it both intuitive and powerful. Its advantage lies in geo-driven insights—tying every KPI to a real-world location—and providing tools that turn data into strategy, not just visuals. For businesses that need clarity, speed, and scalability, Mapline offers the most powerful BI software available.
Yes—Mapline is an excellent alternative to Tableau, especially for organizations that want advanced BI features without the complexity or cost.
Unlike Tableau, which excels mainly at static dashboards and charts, Mapline adds layers of geospatial intelligence, demographic overlays, automated communications, and territory performance reporting.
This makes it uniquely valuable for teams in sales, operations, and field services who need insights they can act on immediately. For companies seeking a BI solution that is easier to use, faster to deploy, and more actionable, Mapline is one of the best alternatives to Tableau.
MAPLINE

TABLEAU

The true power of BI comes from how it’s applied across industries. Mapline enables organizations to move beyond visualization and into execution, turning insights into measurable growth. By combining maps, dashboards, and automation, it empowers leaders to find patterns, forecast accurately, and act faster than competitors. Here are just a few ways BI capabilities drive impact:

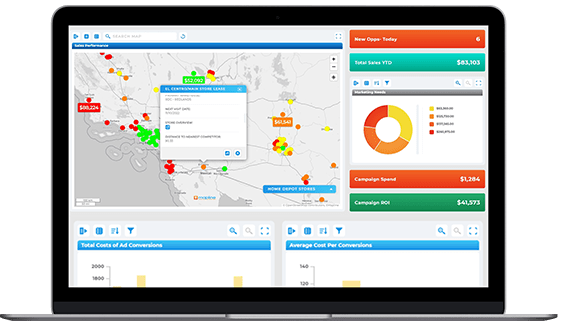
Analytics: Go beyond static reports with interactive dashboards and trend analysis that highlight risks and opportunities. Leaders can monitor performance in real time, drill into details by region or segment, and forecast outcomes with accuracy that supports confident decision-making.

Sales: Visualize territories in ways spreadsheets can’t. Teams can track rep performance, rebalance workloads, and adjust coverage in real time to ensure resources are aligned with revenue potential, improving efficiency while reducing missed opportunities.

Marketing: Layer demographic and competitor data onto maps to uncover exactly where high-value prospects are located. Marketers can then design hyper-targeted campaigns that resonate locally, track ROI by region, and refine messaging for maximum impact.

Pickup & Delivery: Drive-time and distance analysis transforms logistics planning. Companies can streamline multi-stop routes, reduce fuel costs, and cut delivery times—ensuring faster, more reliable service that directly boosts customer satisfaction.

Field Services: Track technician locations, balance workloads, and align schedules with customer demand. With location-based KPIs, managers gain a clear view of coverage gaps and service performance, empowering them to respond quickly and improve outcomes in the field.
In today’s business environment, static dashboards and siloed reports aren’t enough. To truly compete, enterprises need Geo BI—an intelligence platform that combines powerful data visualization with location-based insights and automation.
Unlike traditional BI tools that stop at surface-level analytics, Geo BI delivers the context behind the numbers, revealing patterns that fuel smarter decisions. It helps brands reduce costs, increase efficiency, and scale operations with precision. For leaders who want to move beyond tracking metrics to actually transforming outcomes, Mapline’s Geo BI is the clear choice.
So, don’t just visualize your data— turn it into a superpower! Check it out:
Unlock growth opportunities
By layering demographic, performance, and competitive data, leaders can identify untapped markets with confidence. This makes expansion smarter, faster, and far less risky.

Predict performance trends
Trend analysis connected to location data highlights shifts in customer behavior or regional demand before they become major issues. Organizations can act early to capture advantages or mitigate risks.

Automate data-driven actions
With BI workflows tied to data triggers, businesses can set rules that automatically generate reports, alerts, or communications. This reduces manual work and ensures decisions are consistently supported by the latest data.

Drive smarter decision-making
At every level of the organization, BI transforms raw data into actionable insights. Leaders gain clarity and confidence, while frontline teams have the tools to act faster and deliver better results.
