Map Your Way
to Better Data
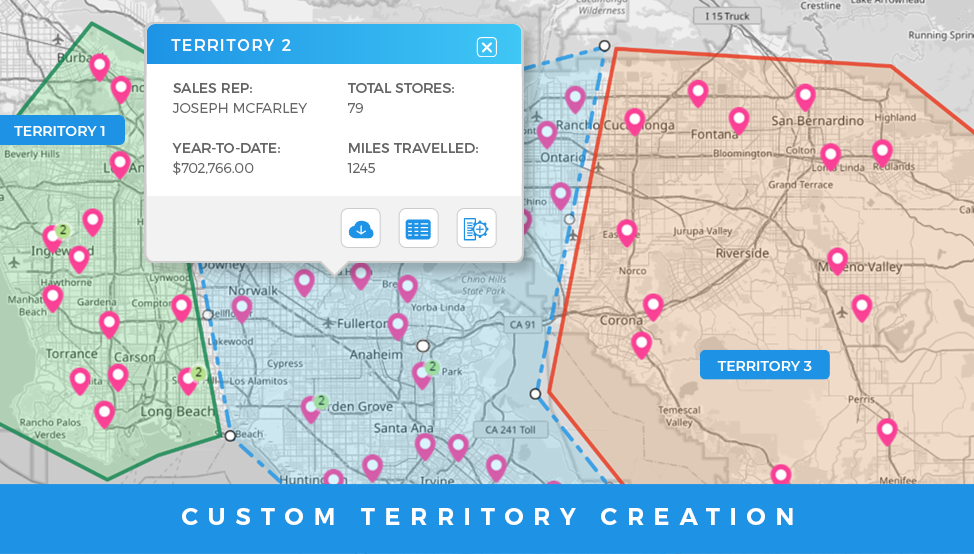
Creating a map from your Excel spreadsheet has never been easier. Simply upload your spreadsheet and you can see all your locations, calculate distances, visualize sales territories, use heat mapping, and much more!

The most powerful mapping software on the planet
Upload spreadsheets, plot locations, add heat maps, draw custom territories, and more

INSTANT INSIGHTS
Choose from hundreds of boundaries, like zip codes and postal codes, from countries all over the world to build the territories that you need. Visualize your data in just a few clicks and dig into deep, data-rich insights like never before!
Custom Colors
Color your boundaries based on volume, revenue, rep assigned, and so much more! Plus, when your data changes, your territory colors auto-update, keeping you in the loop 24/7. Track ROI, team activity, and performance, all in one place.
Identify Trends
Easily identify trends on your map. Dig into key territory data, customer insights, audience metrics, and performance data that influences your bottom line. Quickly identify opportunities and create action plans that keep you and your team ahead in an ever-changing environment.
You’re in good company:


- “Mapline helped us save 47% on operating costs last quarter without changing our fleet size — to say we thrilled is a huge understatement!”– Harvest Roasting Company
- “I’m not a spreadsheet person, so Mapline literally saved my life. It’s so easy to miss stuff with letters and numbers, but then when you see colors, you recognize the gaps instantly and are able to investigate new areas where we can be making money!”– Lydia Rogers, Greenworks Commercial
- “Mapline continues to impress us and is exceeding expectations with its capabilities! The onboarding process was simple and the training we received was outstanding!”– Mike Reese, KisX Card
- “Between manager, supervisors, directors and even higher levels than that, each want to know different, specific information. Mapline dashboards enable me to A La Carte for each palate, all the while making me look like a genius! It is my work endorphin. It’s so gratifying, honestly.”– Lydia Rogers, Greenworks Commercial
- “Interest rates have really impacted our business in the last year, and Mapline has even helped us visualize our fleet and combat inflation. It’s transformed our ability to reorganize quickly. It used to take us months to plan shifts in strategy, but now, Mapline takes that on for us. It’s been huge for our business.”– Thomas Cox
- “Just being able to gather, pull, and map data, all within minutes. You wanna talk about a time-saver? Which is also money-saving!”– Lydia Rogers, Greenworks Commercial
- “I contacted 40 different mapping software companies and sat through probably 15 demos, and Mapline was the clear choice. It’s the best-looking, best-priced software. It’s web-based, lean, intuitive, and it’s exactly what we need.”– John Jordan Miller, Skidmore Pump
- “Our company has tapped into a vein of gold with Mapline, and I am just really thankful. I wish all of my business dealings throughout the day were like Mapline.”– Lydia Rogers, Greenworks Commercial
- “We have campaigns running all over the country & Mapline has provided us an easy way to track, analyze & manage our campaigns.”– Ella Testin, Spark Medical Marketing
- “Above all, the Mapline team has been a breath of fresh air to work with. I have had to sit through many trainings the past 6 months due to growth in our business. But none makes me as excited as when I open my calendar and see an upcoming training or meeting with the Mapline clan.”– Lydia Rogers, Greenworks Commercial
- “Thank you Mapline for such an AMAZING program that is saving us money and building confidence in our future growth!”– Lydia Rogers, Greenworks Commercial


