Market analysis isn’t just about numbers anymore—it’s about location, patterns, and visual context. With the right market analysis mapping software, businesses can identify high-opportunity regions, uncover underserved segments, and outmaneuver competitors. Whether you’re planning a new product launch, expanding into new markets, or reevaluating territory strategy, map-based tools bring data to life in ways spreadsheets simply can’t.
This guide walks through the most valuable mapping features and how they support real-world growth decisions—from heat maps and market segmentation to customer density overlays and competitor coverage zones.
What Is Market Analysis Mapping Software?
Market analysis mapping software transforms geographic and customer data into interactive visualizations. These tools let you see where customers are clustered, where competitors dominate, and where the next best opportunity lies.
Unlike static reports, these tools support dynamic filtering, zooming, layering, and real-time updates, helping teams:
- Visualize customer and sales data by region
- Spot trends in market penetration
- Make location-aware decisions for growth
It’s especially powerful for teams in sales, marketing, retail, and operations—anywhere territory, region, or location influences strategy.


Pro Tip: Before launching in a new region, use regional sales heat maps to analyze current performance, saturation, and customer activity nearby. This can reveal whether your planned expansion is the best move—or whether another territory holds greater potential.
Visual Tools for Market Segmentation and Opportunity Mapping
Segmenting your audience and assessing demand by geography is one of the most effective ways to optimize go-to-market strategies. Mapping tools make this intuitive and actionable by translating complex data into clear visual patterns. You can identify high-potential regions, uncover underserved markets, and tailor your messaging to local preferences—all in just a few clicks. These tools help teams spot whitespace opportunities, prioritize expansion efforts, and align sales and marketing plans with real-world demand. Whether you’re launching a product, targeting new verticals, or reallocating resources, visual segmentation maps provide the clarity needed to move with confidence.
Market Segmentation Maps
Market segmentation maps group customers based on shared characteristics—like demographics, purchase behavior, or business type—and plot them geographically. Use cases include:
- Targeting new campaigns to specific customer groups
- Refining regional messaging based on local profiles
- Personalizing outreach by zip code or city
These insights can dramatically improve targeting efficiency across marketing and sales teams.

Heat Maps for Market Analysis
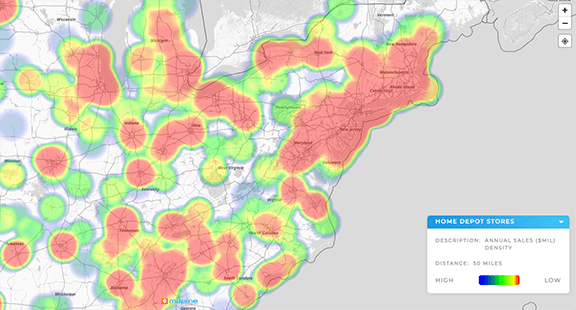
Heat maps for market analysis highlight intensity—of sales, demand, or customer activity—across a defined area. They help teams:
- Identify top-performing areas at a glance
- Compare regions based on conversion rates or foot traffic
- Spot geographic sales gaps or saturation
Heat maps can be layered with other data types, revealing nuanced regional insights you might otherwise miss.

Customer and Competitor Mapping Tools
Seeing your customers—and your competition—on the map helps answer key questions about reach, saturation, and growth potential. These tools allow you to visualize where your customer base is strongest, where gaps exist, and how competitors are positioned across regions. By layering in demographic or performance data, you can assess market share and identify strategic advantages. Competitive heatmaps and customer clustering make it easy to spot overlap or whitespace, empowering smarter decisions about territory planning, resource allocation, and expansion. Whether you’re refining your footprint or entering new markets, mapping brings essential context to every move.
Customer Density Mapping
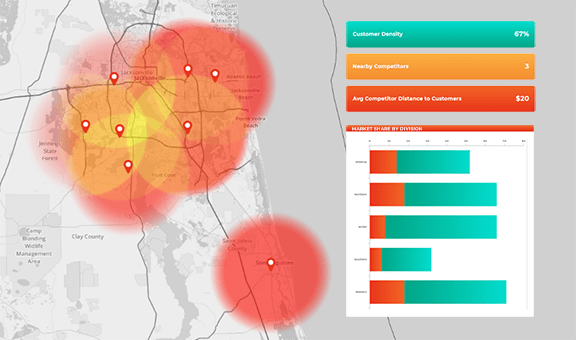
Customer density mapping shows where your customer base is most concentrated. These visualizations help with:
- Route planning for field sales or delivery
- Retail store placement and inventory stocking
- Campaign optimization based on audience proximity
Density maps also reveal blind spots: areas with low or no penetration that could be high-value targets.
Competitive Coverage Analysis
Competitive coverage analysis maps out where your competitors operate—whether it’s physical locations, delivery zones, or service areas. It’s useful for:
- Understanding overlap and whitespace opportunities
- Planning launches where competitors are weak
- Analyzing regional performance gaps
Overlaying your data with competitor zone maps can reveal turf battles, untapped regions, or market dynamics you hadn’t considered.
Regional Strategy: Penetration, Sales Zones, and Expansion
Once you’ve segmented markets and visualized competition, the next step is planning. Mapping tools help define and refine your regional sales approach.
Regional Opportunity Mapping
Regional opportunity mapping highlights areas with the highest growth potential, based on variables like population, existing sales, or competitor absence. You can:
- Score ZIP codes by opportunity level
- Prioritize rep coverage and resource allocation
- Justify new investments with visual data
This reduces guesswork when planning territory expansions or reallocating sales resources.
Map Market Penetration
Map market penetration by comparing existing customers or sales volumes to total market size in each region. This ratio reveals where you’ve saturated a market—and where you haven’t. Benefits include:
- Setting realistic growth goals by region
- Adjusting expectations in over- or underperforming areas
- Targeting overlooked markets with high potential
This is especially useful for subscription-based businesses or retailers evaluating performance across regions.
Business Expansion Mapping
Business expansion mapping lets you simulate potential outcomes by layering population data, competitor locations, existing customers, and regional trends. Teams use this to:
- Plan new store or office openings
- Forecast sales in potential locations
- Present growth strategies to leadership or investors
It’s where market intelligence meets executive planning.
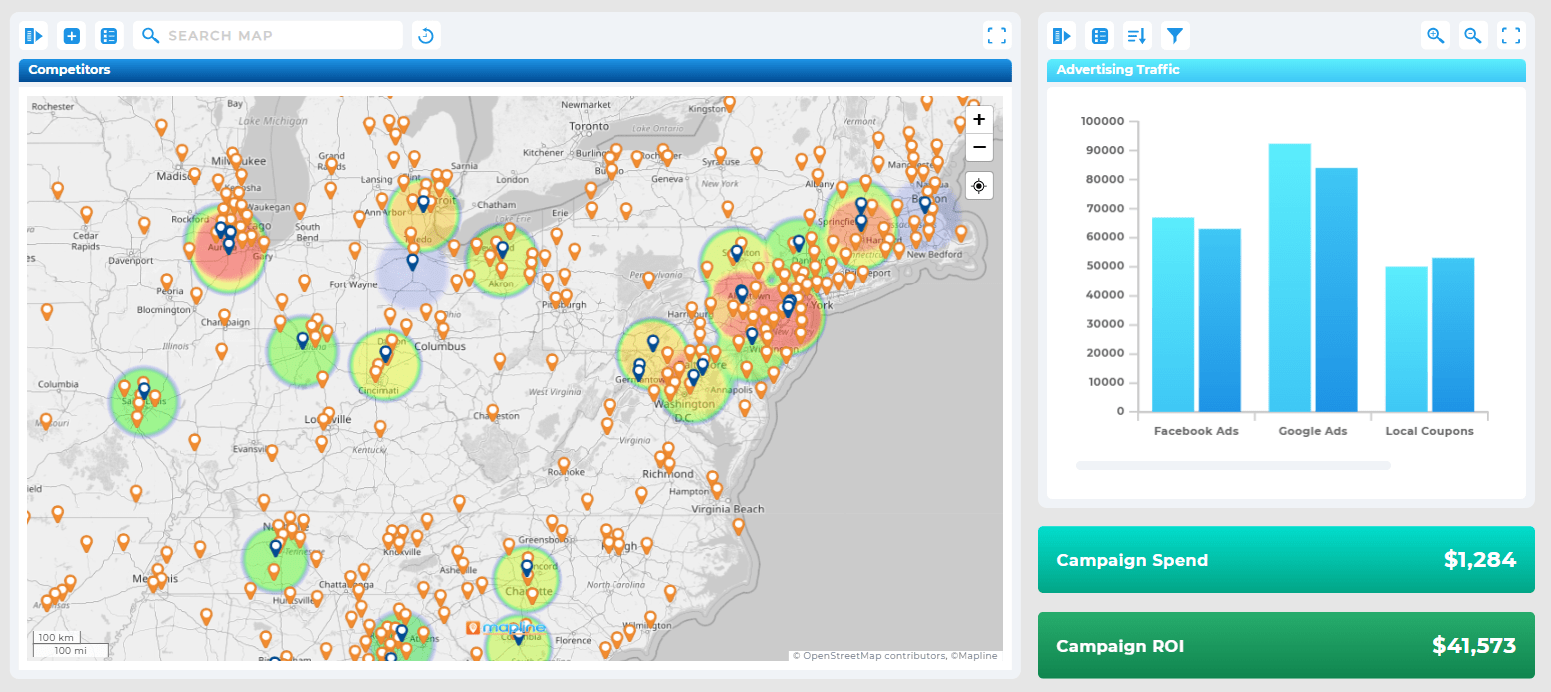
Interactive Market Maps and Dashboards
Static PDF reports are outdated. Today’s teams use interactive market maps and dashboards that update in real time and allow users to explore their data dynamically.
Key features include:
- Layer toggles (customers, competitors, opportunities)
- Dynamic filters for territory, product, or rep
- Embedded insights on each location or region
These maps create alignment across departments—allowing sales, marketing, and operations to see the same story and act accordingly.
Discover the Power of Map-Driven Strategy
Whether you’re optimizing routes, segmenting markets, or forecasting regional growth, the right mapping software turns complexity into clarity. With tools like Mapline, your team can visualize data, streamline operations, and make faster, smarter decisions—all from a single, intuitive platform. No GIS degree required—just results you can see. From territory planning to behavior modeling, every insight is more impactful when it’s mapped. Ready to see your business differently? Start your free trial today and transform the way you strategize.
It helps businesses visualize customer, sales, and competitor data geographically to uncover growth opportunities, optimize territory strategy, and support expansion planning.
Yes. Features like heat maps and market penetration analysis allow you to see where you’re overperforming or underpenetrated in comparison to total market potential.
Customer density maps show concentration, while segmentation maps group customers by shared traits (e.g., demographics or behavior) and plot them geographically.
No. Many platforms scale to smaller businesses with local or regional focus. Even a solo operator can benefit from mapping customer locations and visualizing competitive zones.
Accuracy depends on the source data. Many tools integrate public datasets, industry databases, or allow manual input. The key value lies in seeing patterns and overlap, even if precise boundaries are estimated.


