In today’s fast-moving markets, keeping an eye on your competitors isn’t optional—it’s essential. But traditional market research often lags behind the pace of change. That’s why businesses are turning to market mapping software to visualize the competitive landscape, track real-time movements, and respond with agility. When you can map competitor locations and overlay performance data, you gain a strategic edge grounded in geography, not guesswork.
Mapline makes it easy to build dynamic competitor maps that reveal proximity threats, coverage gaps, and emerging trends. Whether you’re scouting new markets, evaluating expansion risk, or adjusting territories, our tools provide the business location intelligence you need to outmaneuver the competition. In this article, we’ll show how Mapline supports real-time competitor tracking through interactive maps, filters, and live updates.
Why Geographic Intelligence Is Key to Competitive Strategy
Most companies track competitors through reports, websites, or industry chatter—but few visualize them geographically. That’s a missed opportunity. A map of competitor activity reveals patterns that spreadsheets can’t: territory saturation, proximity to key accounts, or regional strongholds that threaten your market share. With modern market mapping tools, you can build a live visual of who’s competing where—and how that impacts your strategy.
Competitive market analysis becomes far more actionable when it’s mapped. You can compare your footprint to theirs, identify blind spots, and allocate resources based on real spatial intelligence. It’s the difference between knowing there’s a threat—and seeing exactly where it’s coming from.
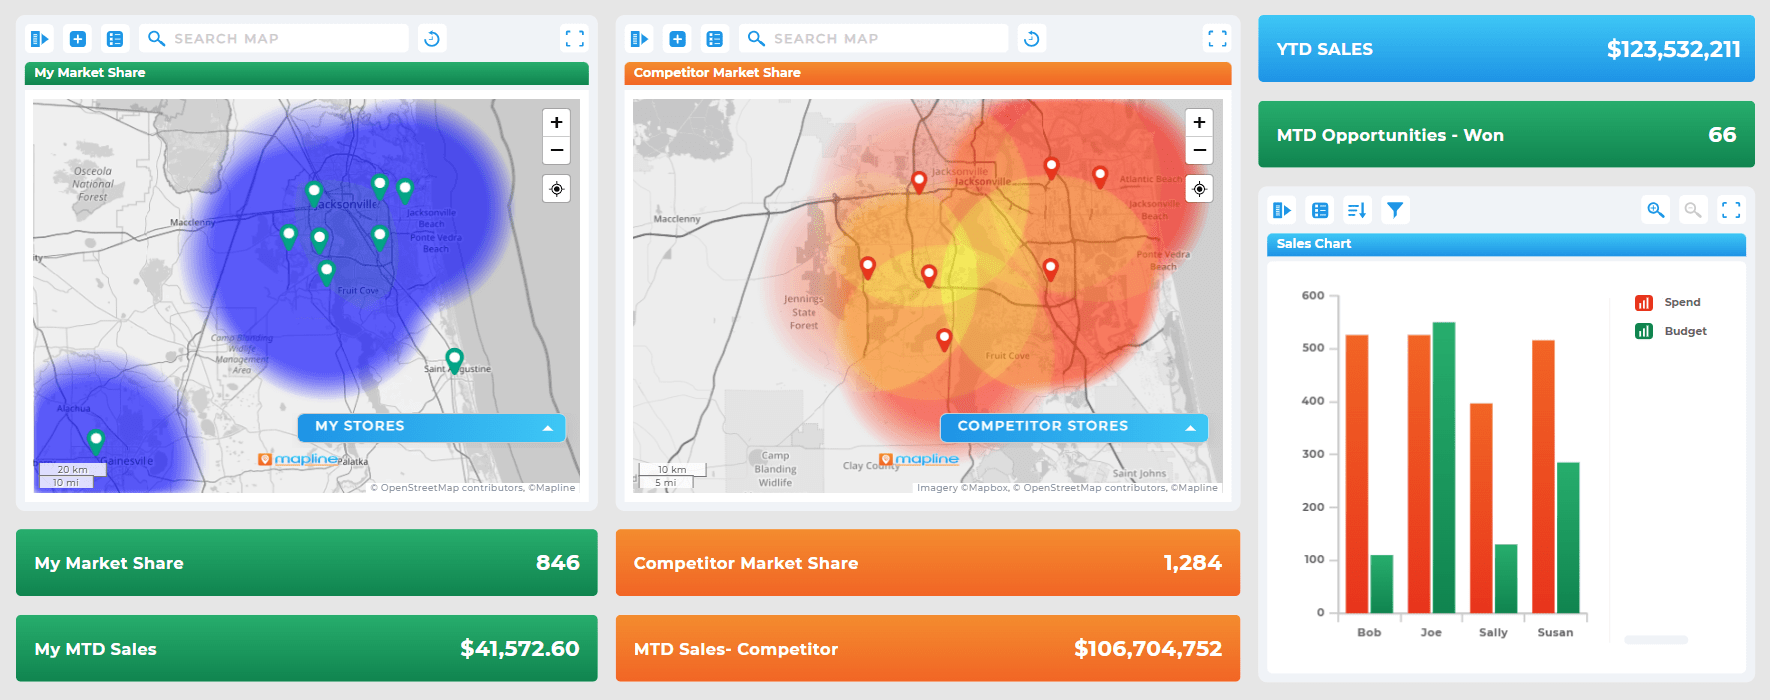

Pro Tip: Want to see your competitive landscape in real time? Mapline’s Market Mapping Software lets you track competitors, analyze overlap, and visualize trends—so you can make faster, smarter moves in any market.
Map Competitor Locations to Track Market Presence
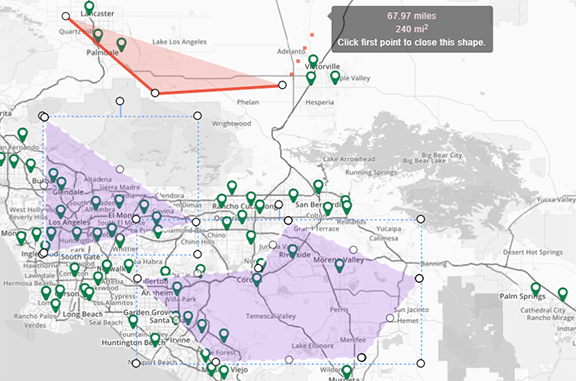
With Mapline, you can import competitor lists or scrape public location data and instantly generate a competitor location map. Each pin can be tagged by company name, market segment, store type, or performance level. You can overlay your own locations to identify overlap, white space, or territory risks. It’s a fast, visual way to understand the real-world positioning of your rivals.
This type of geographic market analysis is useful for sales, marketing, and executive teams alike. Whether you’re protecting key accounts, targeting conquest regions, or planning store openings, competitor mapping gives you the clarity to act with precision.
Plot Competitor Location Data by Region or Brand
Group competitors by chain, service category, or geographic region. You can use filters to isolate specific players or market tiers and visualize how concentrated their footprint is in any given area. This helps identify saturated zones to avoid—or target regions with lower competitive presence. Mapline makes it easy to compare any competitor set against your own presence.
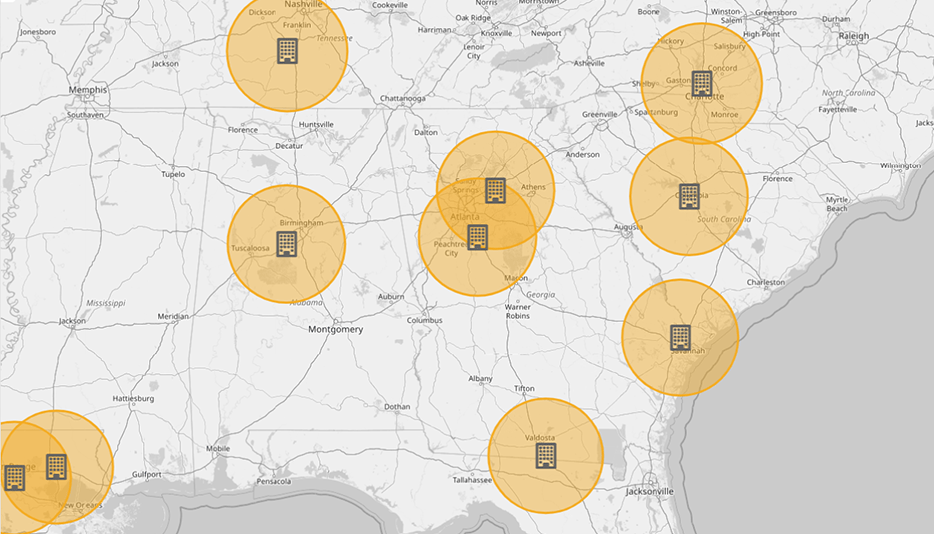
Track Sales Territory Overlap at a Glance
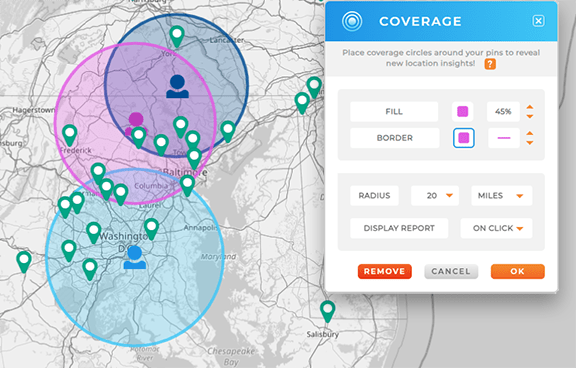
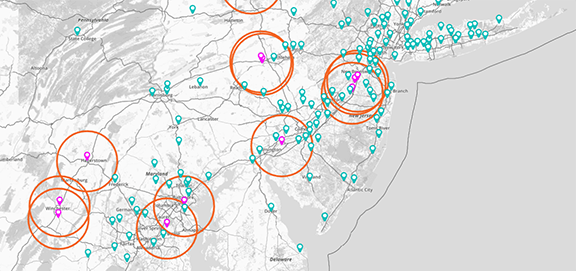
See where your field reps or stores are operating in close proximity to competitors. Sales territory overlap may signal increased churn risk, pricing pressure, or share-of-wallet battles. By visualizing these overlaps, you can focus retention efforts or equip your team with targeted messaging to defend high-risk zones.
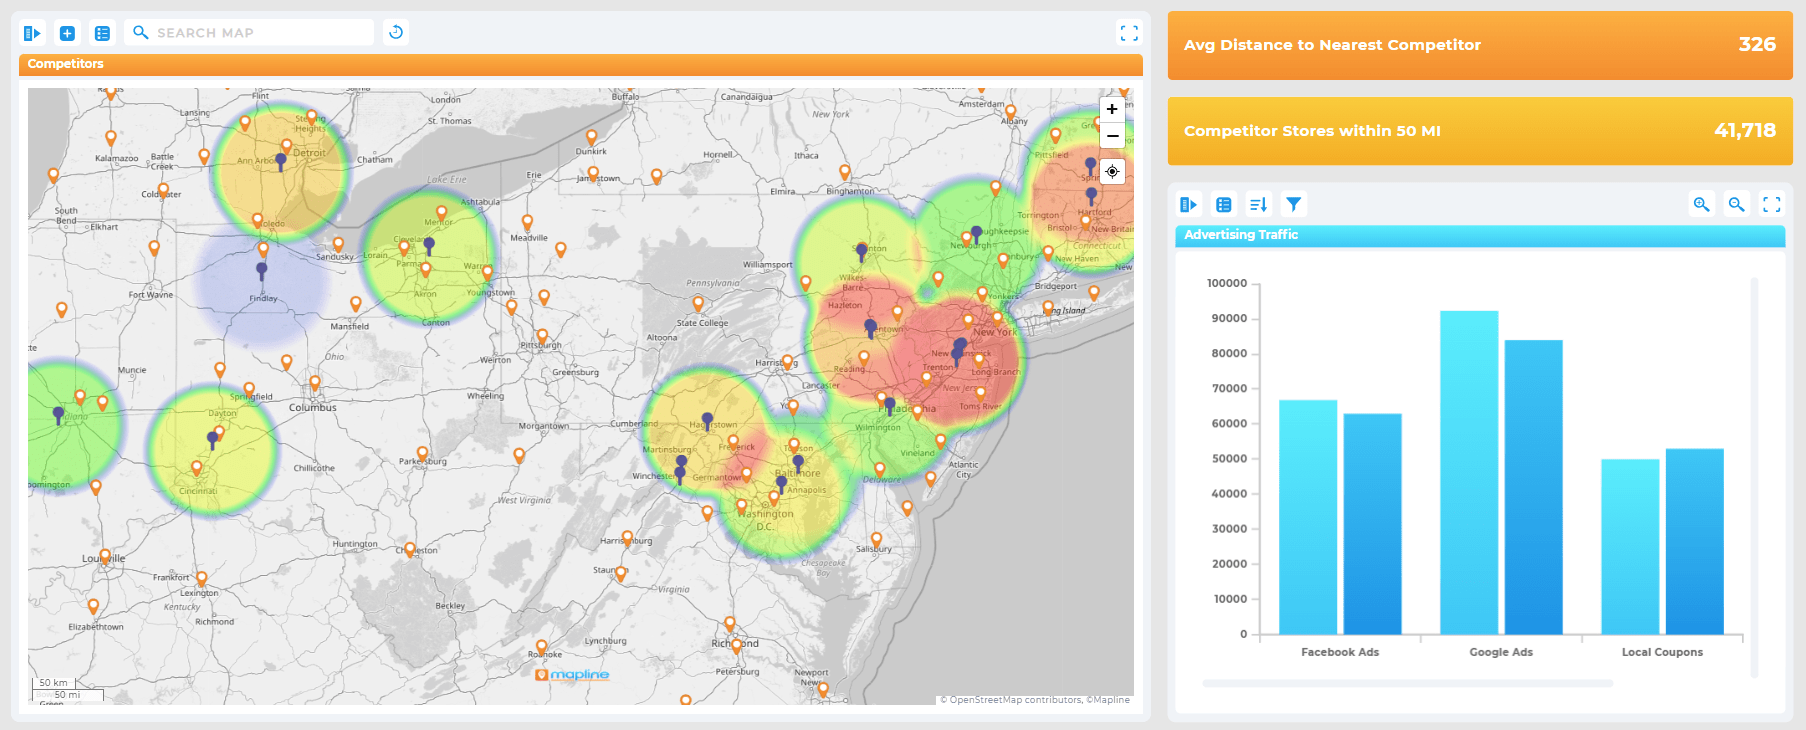
Build a Competitor Heat Map to Spot Market Density
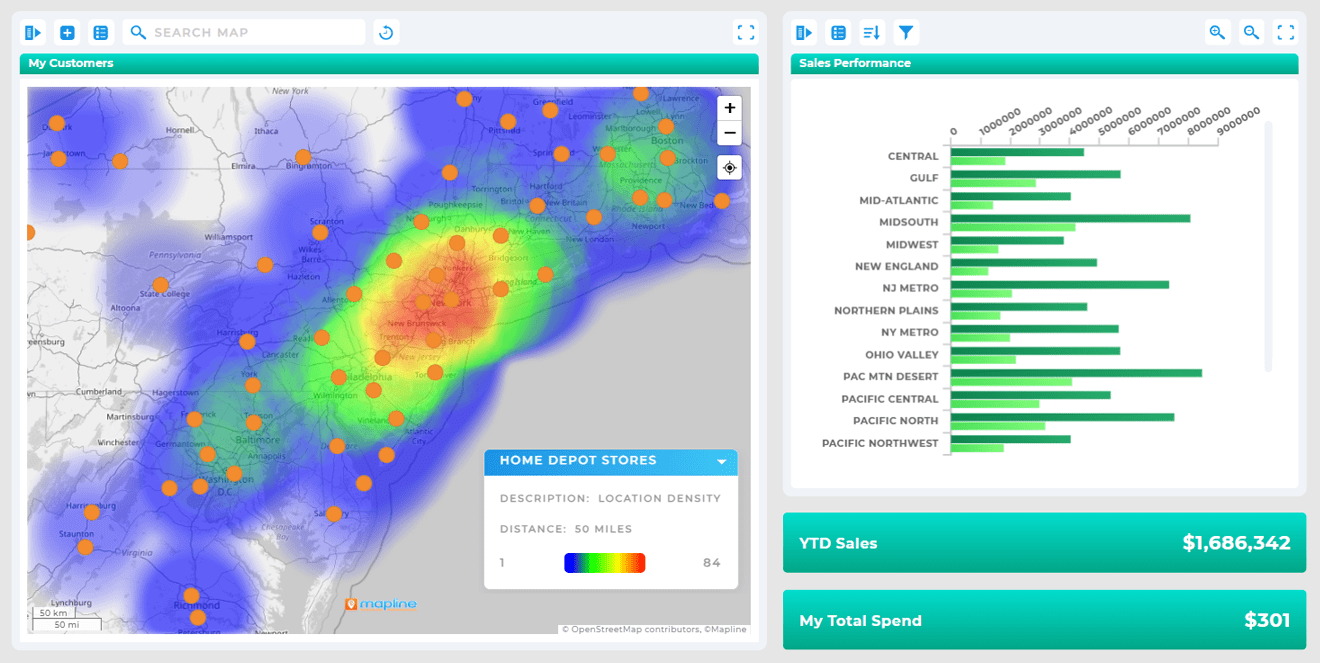
Mapline lets you create a competitor heat map that highlights regions of high density or rapid growth. These visualizations help guide where to reinforce your presence—or where to back off and avoid costly competition. Use heat maps to understand market saturation before making investment decisions.
Monitor Competitor Movements in Real Time
Markets shift fast. New stores open, old ones close, and competitors adjust their footprints regularly. Mapline supports real-time competitor tracking by allowing you to update maps as location data changes. Whether you’re adding new entries manually, importing updated datasets, or integrating with third-party APIs, your maps can evolve alongside the market.
This real-time visibility gives you an edge when planning campaigns, protecting territory, or analyzing market share. You’ll be able to react to changes faster than your competitors—because you’ll see them happening as they unfold.
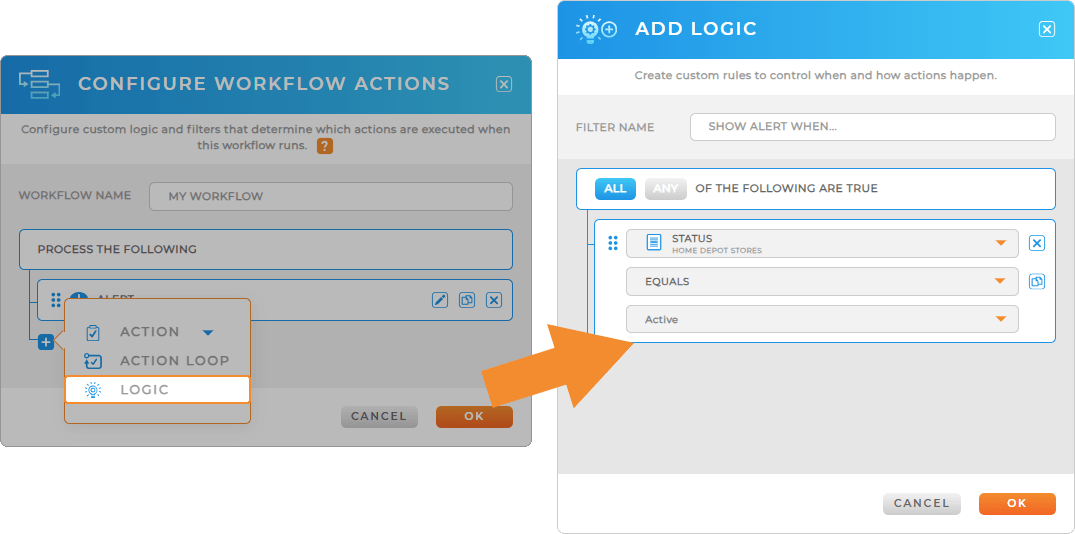
Set Alerts for Competitor Changes in Key Regions
Flag high-priority markets and use data updates to monitor changes in store count, market share, or regional positioning. If a competitor opens a new location near one of your top clients, your team can respond quickly with retention or counter-marketing strategies. Staying informed gives you time to act before business is lost.
Layer Time-Based Data to Analyze Market Trends
Mapline allows you to layer historical and current location data to visualize change over time. Use this for market trends visualization, such as tracking competitor expansion patterns or watching how your territory claims evolve. Seeing the trajectory of change helps you forecast threats and opportunities—not just react to them.
Compare Your Growth With Competitors Side-by-Side
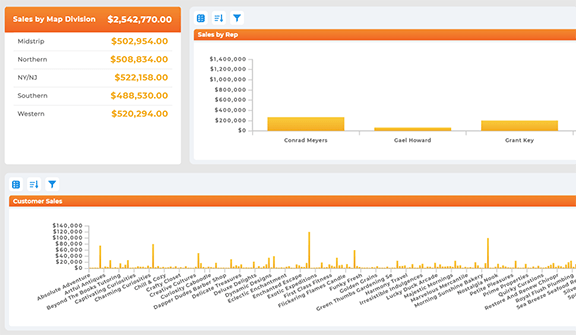
Use maps to show both your and your competitors’ footprint growth by quarter or year. This enables you to benchmark performance and guide strategic planning. Mapping growth visually makes your wins easier to communicate—and your gaps easier to fix.
Use Market Mapping for Smarter Expansion and Defense
Location-based market research isn’t just for defense—it’s also a growth engine. With Mapline, you can use your maps to scout expansion opportunities, plan new territories, or reinforce vulnerable zones. Whether you’re entering a new city or optimizing your current footprint, geographic insight makes the difference between guesswork and strategy.
Our tools help you evaluate trade areas, compare customer access, and simulate market entry scenarios using layered competitor data. The result? Smarter go-to-market decisions based on visibility—not volatility.
Identify Market Gaps for New Store or Rep Placement
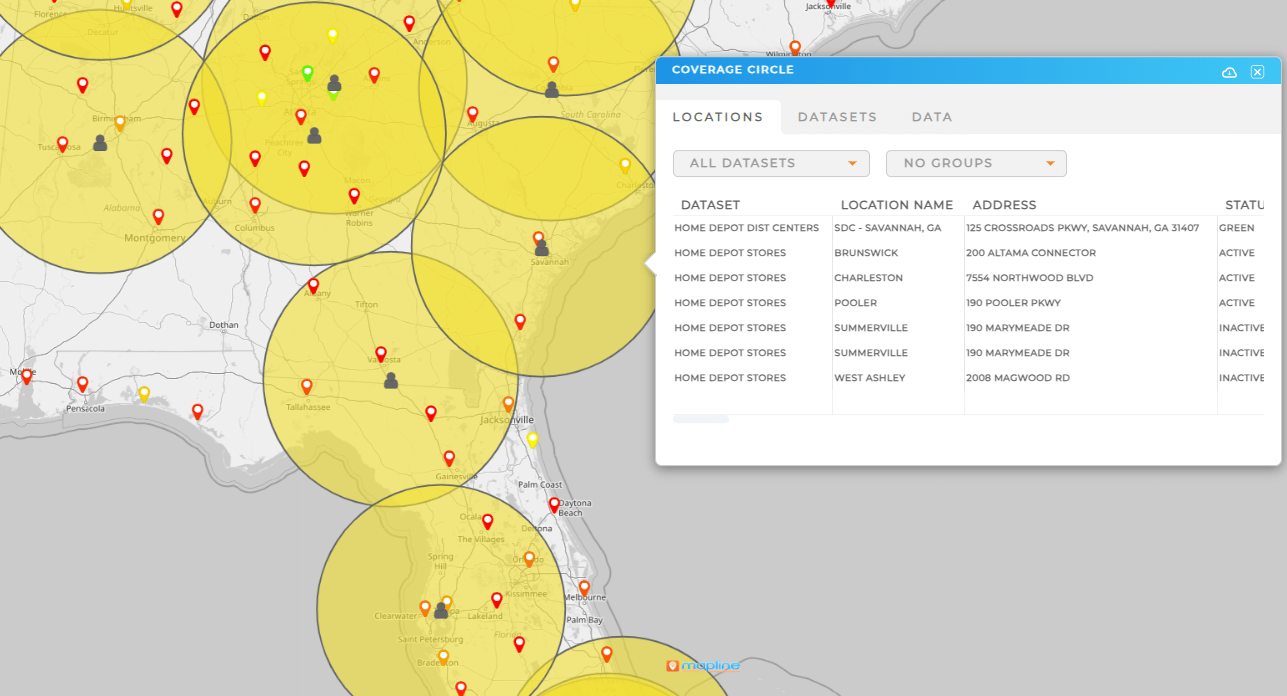
Mapline helps you find regions where competitors are thin but customer demand is strong. Use demographic overlays, drive-time analysis, or existing account clusters to identify ideal placement zones. These insights help reduce risk while maximizing potential during expansions.
Realign Sales Territories to Protect Key Accounts
If competitor pressure is rising in certain areas, you can realign sales coverage accordingly. Use mapping tools to rebalance workloads, shift top reps to competitive zones, or reinforce retention activity in threatened areas. Strategic realignment can prevent churn and preserve market share.
Use Map-Based Reports in Leadership and Investor Presentations
Need to show board members or investors how your competitive position is evolving? Mapline’s visuals are clean, compelling, and easy to embed in decks. Whether you’re showing threats, expansion potential, or historical performance, map-based storytelling wins buy-in and drives better decisions.
It helps businesses visualize competitors, market share, and customer patterns geographically—so they can plan smarter and respond faster.
Yes. You can upload a spreadsheet of competitor addresses or connect to external data sources to build a live competitive map.
Yes. You can manually update data, import refreshed datasets, or connect dynamic sources for live map changes.
Heat maps show areas of competitor density, growth, or decline. These visuals help guide market entry, pricing strategy, or resource allocation.
Absolutely. Sales leaders use it to identify overlap, protect high-risk accounts, and optimize rep assignments in competitive regions.


