- Blog
- Geo Mapping
- MARKETING MAPPING SOFTWARE: WHY IT’S UNDERRATED
Most businesses are sitting on valuable data—customer lists, sales reports, demographics—but struggle to visualize how it all connects. That’s where market mapping software comes in. It’s not just for marketers. From sales to operations to strategy, the ability to see data on a map can surface trends you can’t find in a spreadsheet.
And yet, too many teams overlook it. They use dashboards and charts but miss the geographic dimension that reveals whitespace, opportunity, and risk.
This article explores why market mapping is so powerful—and how to choose a platform that actually helps you grow.
What Is Market Mapping Software?
Market mapping software helps teams visualize customer, competitor, and demographic data on a map. It turns lists into patterns and tables into territories—helping you identify opportunities, spot trends, and act on insight instead of instinct.
This kind of spatial analysis makes it easier to:
- Spot underserved regions
- Compare performance by location
- Optimize territories for coverage and efficiency
- Support data-driven growth decisions
Think of it as an operational layer that pairs perfectly with your CRM or marketing analytics tools—but offers a new dimension of insight.
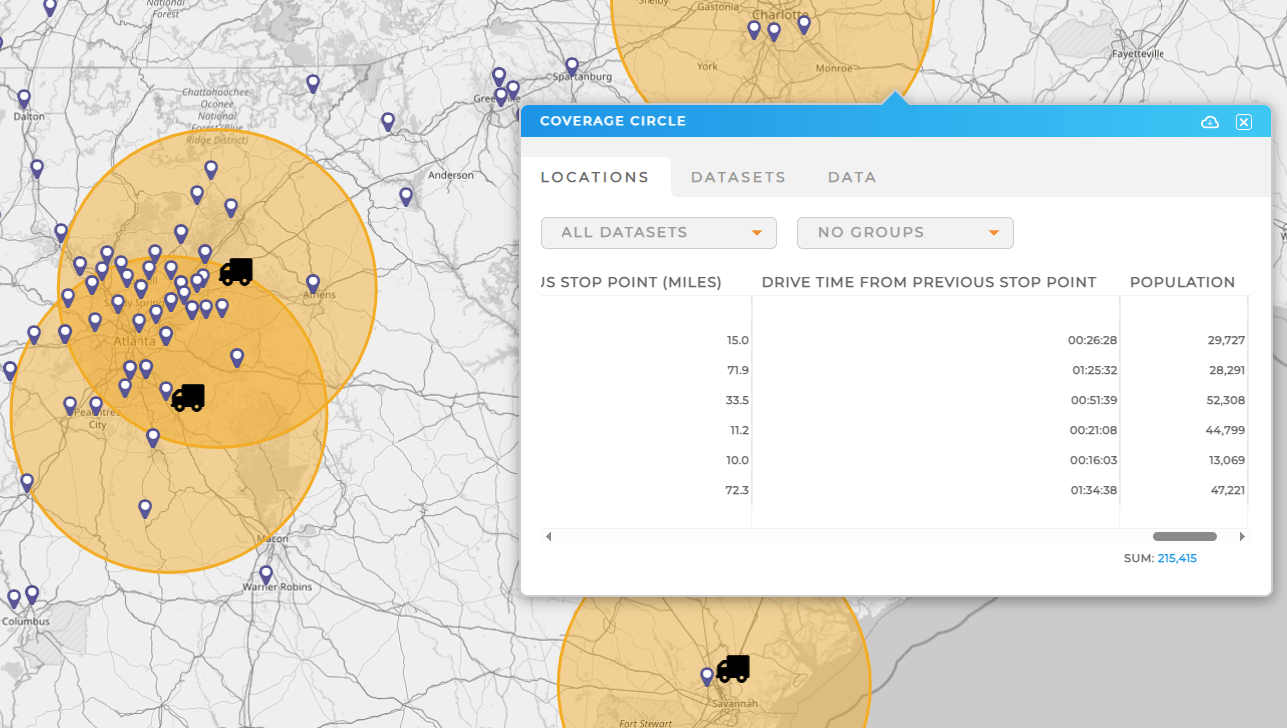

Pro Tip: Mapline lets you turn your marketing data into strategy-ready maps in minutes—no GIS background required. Layer customers, competitors, and demographics on a single view, then zoom in on your next opportunity. It’s more than analysis—it’s your new strategic command center.
Market Analysis Mapping Software: What It Really Shows You
Visualizing customer density, competitor locations, or regional performance transforms how you plan your go-to-market strategy. With market analysis mapping software, you can:
Surface Strategic Gaps
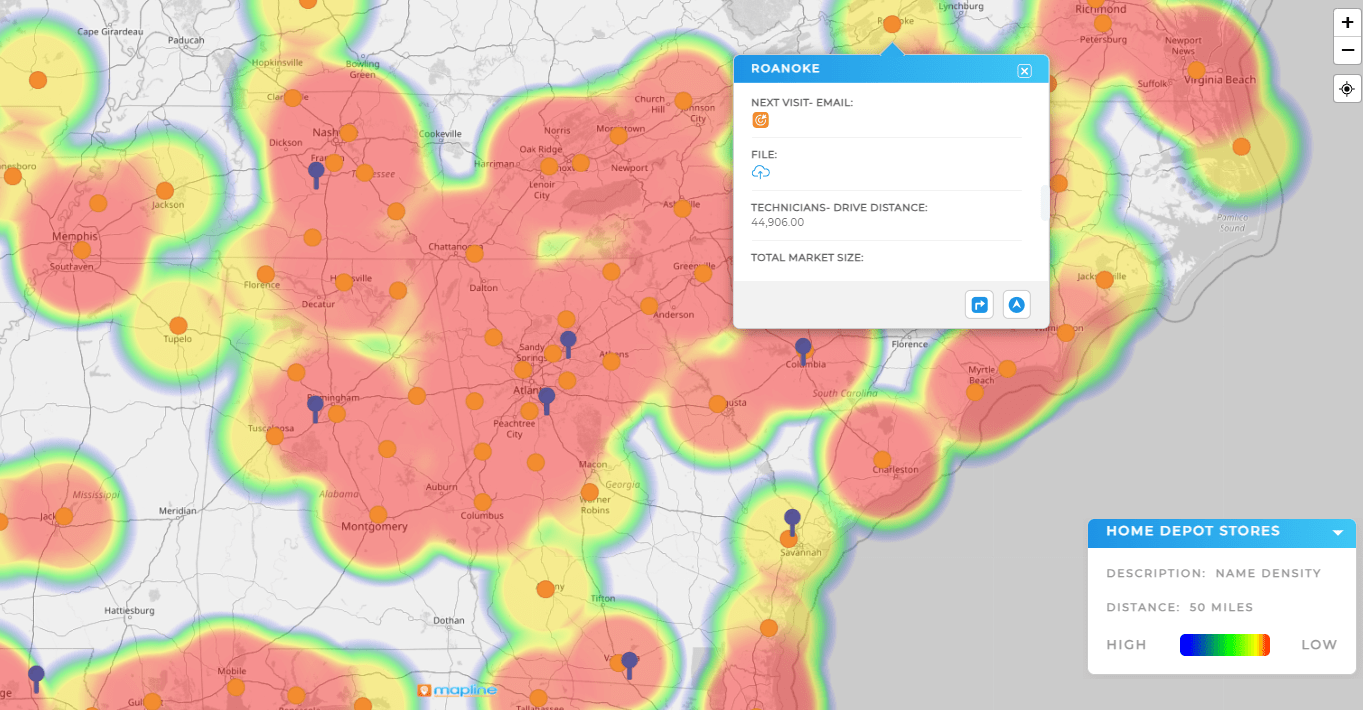
See where customer density is high but rep coverage is low—or vice versa. These gaps are easy to miss in standard reports, but obvious on a market map.
Run Market Assessment Analysis
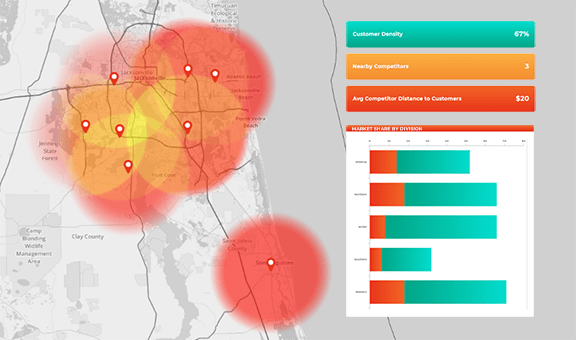
Evaluate a new region before entering. A solid market assessment analysis combines internal data (sales, customers, revenue) with external data (population, income, competition). Mapping makes it easy to layer this data into a single view.
Guide Strategic Planning with Visual Precision
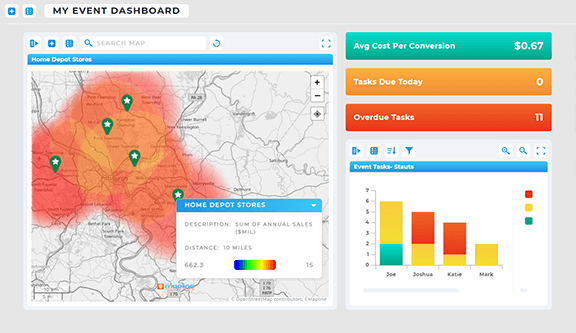
When planning expansion or retraction, the visual clarity from a map helps align stakeholders. It becomes easier to justify decisions when you can point to data on a map—not just in a spreadsheet.
Competitor Research and Analysis: See Your Position Clearly
Forget theoretical SWOT grids. Competitor research and analysis is way more useful when grounded in geography. A competitor analysis tool with mapping features helps you:
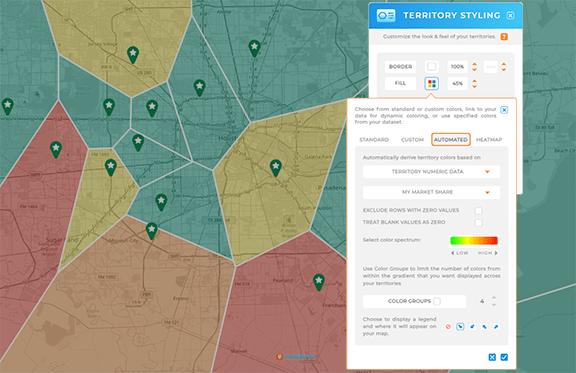
Map Market Share by Territory
Plot competitor locations and your own. You’ll immediately see overlapping zones and untouched markets. Combine this with sales performance to see who’s winning where—and why.
Compare Proximity to Key Accounts
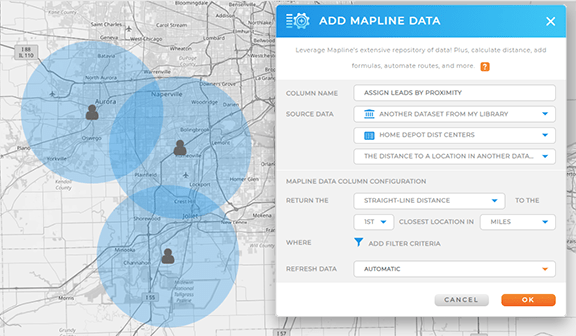
Mapping helps you analyze how close your reps or stores are to high-value customers—compared to competitors. This can shape outreach strategies and territory design.
Layer in Marketing Data Analytics
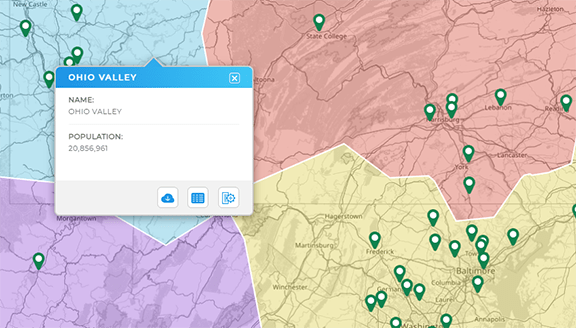
By combining marketing analytics data with physical locations, you see not just who is buying, but where they’re concentrated—and where you’re underrepresented.
Why More Marketers Are Turning to Mapping
The rise of geospatial tools in marketing isn’t a trend—it’s a response to complexity. With data coming in from multiple platforms, marketing mapping software helps teams simplify, visualize, and act faster.
Leading marketing research platforms now include location intelligence features. Here’s what they unlock:
Customer Segmentation by Region
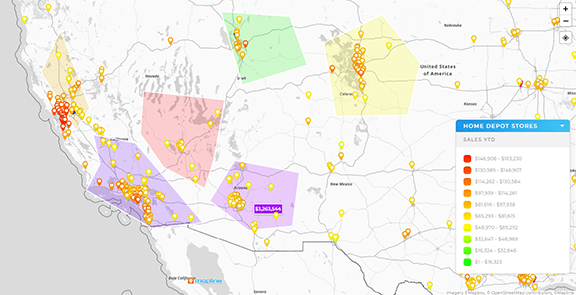
Build smarter campaigns by mapping customers by behavior, revenue, or lifecycle stage—then targeting specific ZIP codes or cities accordingly.
Performance Analysis by Geography
With marketing maps, you can compare campaign results across different regions and make smarter allocation decisions.
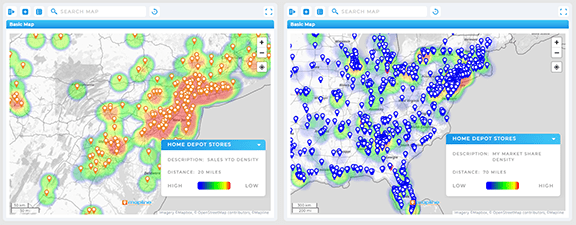
Examples of Market Assessment That Stick
Mapping makes it easy to present a compelling example of market assessment to leadership. It’s hard to ignore a map that clearly shows opportunity zones or competitive threats.
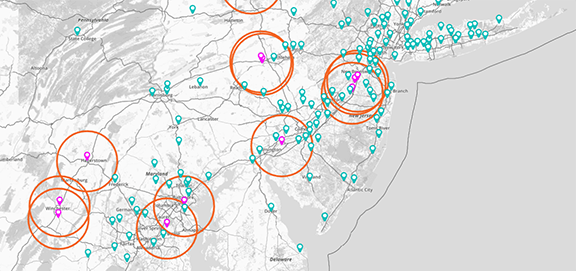
Free vs. Paid Market Mapping Software: What You Get
There are dozens of market research tools out there, and many offer “free” versions. But what do you actually get?
| Tool | Free Version? | Pin Mapping | Territories | Interactivity |
|---|---|---|---|---|
| Mapline | Yes- Mapping Starter | Yes | Yes | Yes |
| Easy Map Maker | Yes | Yes | No | No |
| Maptive | Yes | Max 250 Locations | Limited | Limited |
| Domo | Yes- with Domo Free Credits Only | Yes | Limited | Yes |
It’s the process of comparing your company’s position against rivals. Market mapping tools help visualize this by territory, region, or customer type—making it easier to spot growth areas or over-saturated zones.
It depends on your goals. If geographic visibility is critical, choose a platform like Mapline that offers both location analytics and business intelligence tools in one place.
It combines customer data, competitor locations, and regional demographics on a map. You’ll want clear takeaways on where to expand, where to pull back, and what segments are under-penetrated.
Absolutely. Adding spatial context to analytics turns raw numbers into action. It helps you target smarter, plan better, and align your teams more effectively.


