THE MOST DYNAMIC
DASHBOARDS
& CHARTS
ON THE PLANET

Visualize Everything
Dig even deeper to discover more insights than ever before!

Dynamic Dashboards
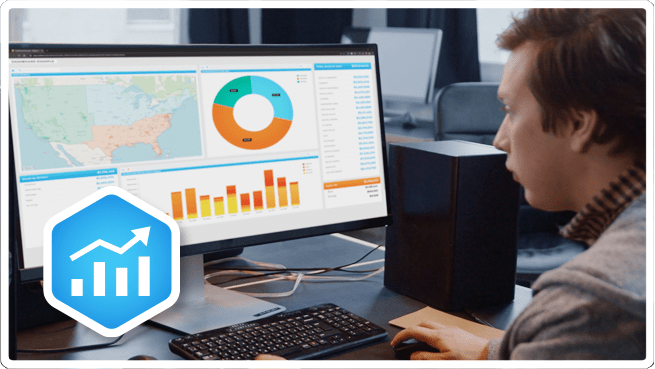
Configurable and responsive, our dashboard system enables you to create accessible displays of your most vital information that can be shared with everyone who needs to know.

Charts and Graphs
Quickly transform your data into customizable charts and graphs that effectively communicate information, help reveal valuable insights, and provide real-time updates!

Robust Reports
See exactly what you want to see by using our intuitive drag-and-drop pivot table creation system. Aggregate and display specific elements from your unstructured data in minutes instead of days!

Amazing Metrics
Metrics are a powerful way of showcasing critical data in a focused way. Fully customizable, you can use multiple metrics to keep track of Key Performance Indicators (KPIs) and more!

Maps (Of Course)
See exactly what you want to see by using our intuitive drag-and-drop pivot table creation system. Aggregate and display specific elements from your unstructured data in minutes instead of days!

Distance Reporting
Incorporate distance calculations into your data and then see everything your charts and reports have to offer.

Territory Reports
Build charts based on your map information. Automatically aggregate charts reporting performance based on territories your locations fall into.

Curated Data Lens
Add Mapline’s Curated Data such as Population or Income to your dataset and visualize your company performance relative to demographic slices.
Rich Data Tools
Use our powerful visualization software tools to discover all your data has to offer.

Filter Everything
Apply filters to any visual on your dashboard. Quickly drill down on-the-spot to better understand your data and get answers fast!

Advanced Sorting
Mapline gives you incredible sorting flexibility. Sort your charts and reports based on your input data or the aggregated values.

Embed and Share
Easily share your visuals with the right people. Mapline makes it easy to share with others or embed on websites.

Various Chart Types
Tap into Mapline’s bar, line, pie, donut, area, 100% area, and scatter charts to drive your analysis.

Export Visuals
Export your charts, reports, and maps to use in your own PowerPoint presentations or distribute to your team.

Instantly Access Data
Right click on any chart bar, metric, or report value to view the raw data used to calculate the value. Edits can be instantly done on the spot.

Organize visuals
Place your charts and metrics anywhere on the screen that matters.

Mobile Friendly
Mapline’s responsive design means that when you open your mobile to see a dashboard, everything will adapt to the screen.

Custom styling
Customize your styling with colors, labels, and legends to quickly understand what you are looking at.

Automation
Save time and eliminate tedium! Use dynamic data to set up your reports once and let Mapline BI do the rest!

Powerful API
Get live updates to your dashboards by seamlessly connecting a database through our API – now the data you need is always at your fingertips.

Easy Access
Centralize your data and then share dashboards and other visualizations from one place.
Your Dashboards, Your Way
Customize your dashboards to give you exactly what you need when you need it!

Customized visuals
Mapline can help to quickly convey information using all types of visuals. Add charts, reports, and metrics to your dashboard to magnify your data’s impact.

Real-time
Everything updates with your data! So rather than spending your time updating spreadsheets, you can focus on discovering insights and driving business!

Drill down
Forget about executive requests to “come back” with updated analysis. Just do it in the moment! Drill up and down to find those gems within your data.

Location relevant
Combine BI with Mapline Data and you can collect all types of data into your charts and dashboards. Show the average income around your customers or chart the impact of population on your stores.

Q: WHAT MAKES MAPLINE SO DIFFERENT?
A: OUR PROPRIETARY GEOSPATIAL ENGINE
Q: WHAT MAKES MAPLINE SO DIFFERENT?
A: OUR PROPRIETARY GEOSPATIAL ENGINE
We are the only software solution built from the ground-up on our innovative Geospatial technology that leverages the power of distance and location in your data. We let you see exactly where you are, then help you chart a course to where you want to be! We are the only software solution built from the ground-up on our innovative Geospatial technology that leverages the power of distance and location in your data. We let you see exactly where you are, then help you chart a course to where you want to be!


