Why High-Velocity Operations Need Different Metrics
Fast-moving industries face constant shifts — from traffic disruptions and surprise cancellations to demand spikes and urgent service requests. In this environment, stale or overly broad KPIs don’t provide enough actionable insight. High-velocity teams need metrics that are immediate, granular, and directly tied to daily execution. These KPIs should reveal whether the operation is ahead, behind, or trending toward a bottleneck long before it becomes a major issue. With better metrics, leaders can react quickly, allocate resources intelligently, and maintain operational momentum even under stress.
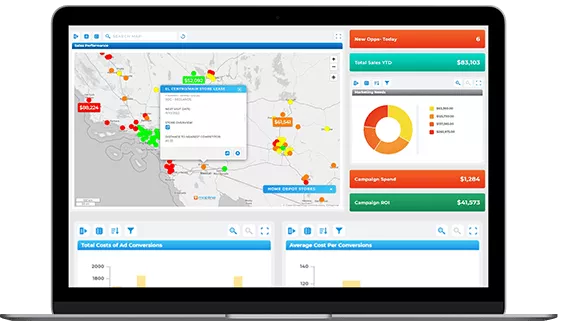
Pro Tip: Pair these seven metrics with map-based insights for an even clearer operational picture. When data is visualized geographically, trends become easier to understand and action becomes faster and more precise.
Slow-Refresh Metrics Hide Real Problems
Daily or weekly reporting cycles can mask issues until it’s too late. High-volume teams need minute-by-minute visibility into how operations unfold. Metrics with outdated data create blind spots that lead to inconsistent performance. Real-time KPIs, on the other hand, help teams resolve issues early and reduce the downstream impact of delays.

High-Velocity Teams Require Granular Insight
Broad KPIs like weekly totals or averages are too general to support fast execution. Teams need granular metrics that track specific steps, regions, or technicians in real time. This granularity reveals patterns that otherwise remain invisible, helping leaders intervene with precision rather than guesswork.

Operational KPIs Must Guide Immediate Action
For metrics to be useful in a high-speed environment, they must clearly suggest the next step. Actionable KPIs show not only what’s happening but what needs to change. Metrics that simply report outcomes without pointing to causes or solutions slow down decision-making and create confusion across teams.
1. On-Time Completion Rate
On-time completion is the heartbeat of high-velocity operations. It measures how well teams meet deadlines for deliveries, service visits, or appointments. A strong on-time rate improves customer satisfaction and reduces the cascading delays that derail busy schedules. Tracking this metric hour by hour helps teams identify emerging slowdowns and take corrective action quickly.

2. Stops Per Hour (or Jobs Per Hour)
This productivity metric reveals how efficiently teams complete work throughout the day. High stops-per-hour numbers indicate good sequencing, strong planning, and minimal downtime. When this metric dips unexpectedly, it signals workflow issues such as traffic delays, poor routing, or overly long service durations. Monitoring productivity in real time enables rapid intervention.

3. Average Service Duration Variance
High-velocity operations depend on accurate time predictions. When service durations take longer than planned, schedules break down quickly. Tracking variance between expected and actual service time uncovers inefficiencies, skill mismatches, or missing information. Reducing variance improves schedule accuracy and prevents unexpected backlogs.

4. Utilization Rate by Technician or Vehicle
Utilization rate measures how effectively each resource is used during a shift. Balanced utilization prevents burnout while reducing idle time across the fleet. Monitoring this metric helps leaders identify imbalances that could be slowing down the day — such as overloaded trucks or underutilized technicians. With stronger load distribution, teams optimize both performance and morale.

5. First-Attempt Success Rate
Nothing slows down operations faster than repeat visits or failed attempts. First-attempt success measures how often tasks are completed correctly on the first try. Low success rates reveal issues with training, missing information, or mismatched skill requirements. Improving this metric reduces rework and keeps the schedule running smoothly.

6. Route or Schedule Deviation Rate
This metric shows how often real-world execution deviates from the planned route or schedule. High deviation rates indicate issues such as inaccurate routing, traffic disruptions, or operational delays. Tracking deviations helps leaders understand where planning gaps exist and how well the system adapts in real time. Lower deviation rates lead to tighter, more reliable daily execution.

7. Exception Volume and Resolution Time
Exceptions — missed stops, cancellations, delays, urgent add-ons — are inevitable in high-velocity operations. This metric tracks how many exceptions occur each day and how quickly teams resolve them. High exception volume or slow resolution times indicate that operations lack flexibility or adequate real-time adjustment. Improving this KPI strengthens resilience and prevents minor issues from spiraling into major performance problems.

Metrics Create Predictability in Daily Execution
Real-time KPIs help teams anticipate issues before they escalate. By spotting changes early, leaders adjust resources, update routes, or communicate delays proactively. Predictability supports better planning and improves customer satisfaction.

Clear KPIs Keep Teams Aligned
When everyone sees the same metrics, communication becomes easier and expectations become clearer. Shared KPIs reduce confusion and keep teams focused on what matters most — productivity, reliability, and customer outcomes. Alignment across departments boosts overall efficiency.

Real-Time Visibility Builds Operational Agility
High-velocity teams cannot wait for weekly reports. Real-time visibility enables rapid adjustments to schedules, routes, and workloads. This agility helps organizations stay competitive and handle high volumes without sacrificing performance. With faster insights, teams deliver stronger results day after day.
