Quick Reference Guide
Maps: Folder Report
Pro Tip: Folder Reports work best when you have both pins and territories (or shapes) applied to your map. This is because your territory must contain data (aka, pins) in order to generate a report.
If your folder contains multiple territories or shapes, the Folder Report displays a summary of each territory in your Layer Folder.
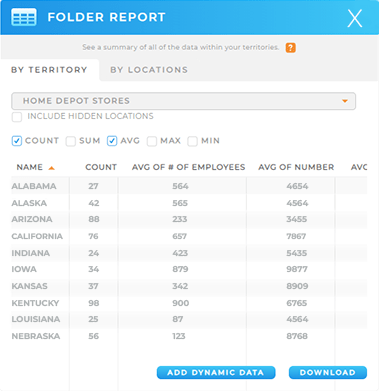
BY TERRITORY
Here, you have access to a complete breakdown of information for each territory in your Layer Folder.
Include Hidden Locations Checkbox: Include locations from your dataset that are hidden on your map.
Count Checkbox: See pin counts by territory.
Sum Checkbox: See a sum of sales by area.
Average Checkbox: Calculate an average of all the numerical columns in your dataset.
Max and Min Checkboxes: Calculate a maximum or minimum of all the numerical columns in your dataset.
Add Mapline Data Button: To add more advanced calculations, including formulas, demographic data, or information contained in another dataset, click the blue Add Mapline Data button in the bottom-right corner of your screen.
Download Button: Download the entire report as a CSV file.
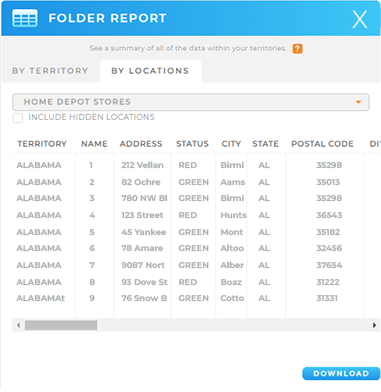
BY LOCATION
Here, all of your data is sorted by location. This is useful if you want to see data for each individual pin in your territor(ies).
Click the drop-down menu to toggle between datasets, or click the blue Download button in the bottom-right corner of the screen to download this report as a CSV.