Quick Reference Guide
Coverage Areas
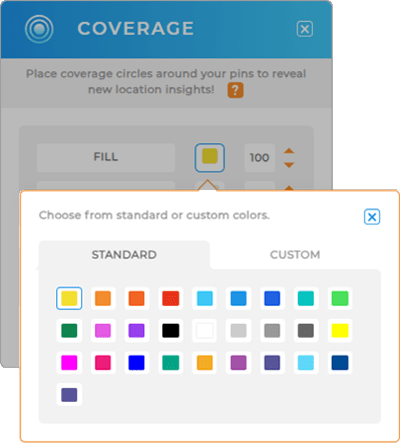
FILL & BORDER COLOR
Colors are a fantastic way to highlight coverage areas.
To choose your fill and border colors, click the color box. Pick from presets or set your own custom colors by clicking the CUSTOM tab and pasting in a hex code.
Need to spot stores within a specific radius? Select a fill color that stands out from your map pins for quick identification.
If you prefer a more subtle look, adjust the fill opacity to avoid overpowering your map.
Or, maybe you don’t want a fill color at all. Simply set the opacity to 0% and you’re all set!
RADIUS
Choose the radius in miles, feet, kilometers, yards, or meters. It’s a great way to uncover new insights within your coverage areas.
For example, draw a 20-mile radius around each sales representative’s territory to spot both challenges and opportunities in that area.
You might find that one representative has more clients than they can handle, while another has fewer customers. Or maybe one rep’s clients are located 50 or 60 miles away from their main area.
Spotting these challenges helps you fine-tune your operations for better ROI. That’s the magic of drawing coverage circles around your pins: it reveals where you can make adjustments for greater efficiency.

DRIVE DISTANCE POLYGONS
Drive distance polygons help you understand real-world travel coverage based on actual road networks rather than simple straight-line distances. Whether you’re managing delivery areas, sales territories, or service zones, these polygons, or isochrones, allow you to define boundaries based on how far a vehicle can travel in a set number of miles or kilometers. This ensures that your coverage areas are accurate, efficient, and tailored to real-world constraints, helping you optimize operations and reduce unnecessary travel time.
To add drive distance polygons, click the distance dropdown and select DRIVING DISTANCE. Enter the number of miles or kilometers you want to analyze, and Mapline will generate a precise boundary that reflects real travel paths. Use this feature to streamline logistics, improve route planning, or ensure your team is operating within optimal travel ranges.

DRIVE TIME POLYGONS
Drive time polygons are essential for businesses that rely on efficient travel planning, service coverage, and customer reach. Unlike basic radius maps, these polygons provide real-world accuracy by factoring in actual road networks and speed limits.
First, click the distance dropdown and select DRIVING TIME. Set the number of minutes you want to analyze, and choose the type of vehcile for which you want to optimize, and Mapline will auto-generate accurate travel boundaries around the pins in your selected layer. Use this feature to refine territory planning, reduce inefficiencies, or ensure that your resources are strategically allocated for maximum impact.

COVERAGE CIRCLES- APPEARANCE
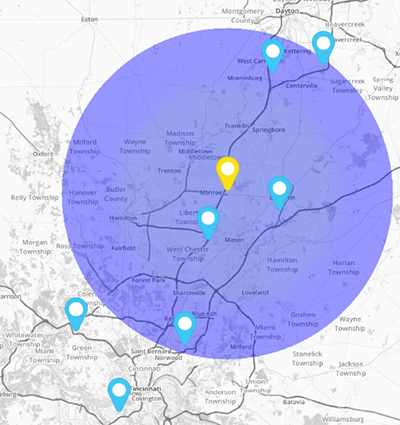
Imagine we’ve added coverage circles with a 20-mile radius around our distribution centers.
In this example, two stores fall outside the coverage area. This creates logistical challenges like longer delivery times, more mileage, and extra costs for staff.
Our solution? We’d need to expand the coverage area for that distribution center or consider opening a new one nearby.
DRIVE TIME ISOCHRONES + DRIVE DISTANCE POLYGONS- APPEARANCE
When it comes to mapping drive time or distance coverage, many mapping platforms rely on hexagonal models to estimate how far a driver can travel within a certain time frame. While this approach provides a rough idea of travel time, it doesn’t account for actual road networks, speed limits, or driving time, which can lead to inaccurate conclusions for businesses relying on these calculations.
Mapline’s drive time polygons offer a more advanced solution. Rather than using basic hexagons, our polygons conform to real road networks, creating a more accurate, spiderweb-like shape that follows actual streets and highways. This method ensures that your coverage areas are based on precise travel times, not just approximations.

ADDITIONAL FEATURES
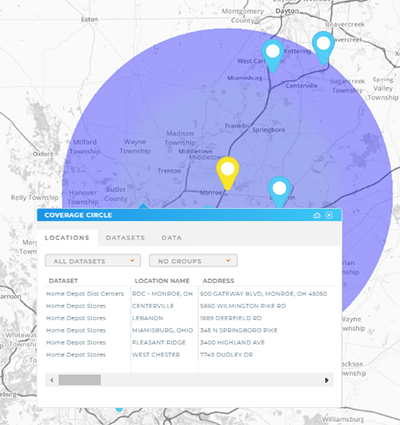
Click on a coverage area to view a summary of the data within that circle. Download the report and share it with your team to gain even more territory insights!
If you ever want to remove coverage from your map, just navigate back to the Coverage lightbox and click the red Remove button at the bottom of the screen.
Alternatively, if you want to toggle your coverage areas on and off, simply add a duplicate Layer Folder to your map. One folder can have coverage areas applied, while the other contains your clean data. Use the sidebar to turn these folders on and off as needed.
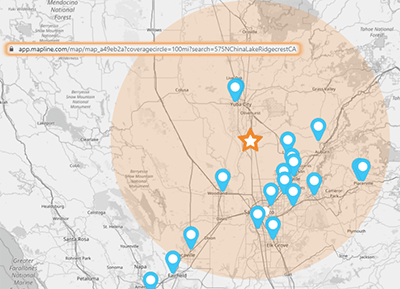
Coverage Circle Shortcut
Here’s a quick shortcut for adding a temporary coverage cirlce to your map!
URL variables are quick, easy perameters you can add to your map’s URL.
For example, say we want to add a coverage circle with a 100-mile radius around one of our distribution centers. Just click into the URL bar and add the following text to the end of your URL:
?search=575 N China Lake Ridgecrest, CA?coveragecircle=100
Substitute the address above for the acutal address you need to add your coverage circle around.