Quick Reference Guide
Segments
- Quick Reference Guide
- Segments
Segments in Mapline are a dynamic tool that allow you to visually differentiate between various categories within your data, making it easier to spot patterns and understand trends at a glance. Whether you’re managing customer engagement, assessing store performance, or organizing field teams, segments help you categorize and visualize your data more effectively.
Quickly distinguish between active and inactive customers, or compare high-performing stores against those that are underperforming—all on the same map. Or perhaps you need to organize technician teams by their leaders to streamline operations and improve communication. With segments, these tasks are not just possible—they’re simplified and enhanced. The possibilities are truly endless, offering you a flexible way to tailor your data visualization to meet your specific needs and objectives.
Let’s dive deeper into how implementing segments can revolutionize your analytics and decision-making processes, empowering you to make informed, data-driven decisions that drive business success.
TIERS
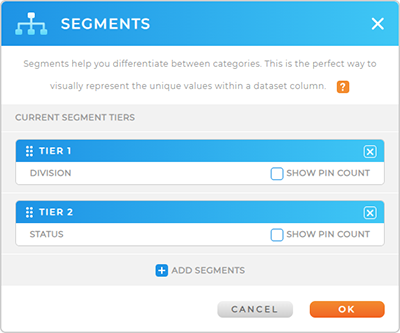
Assign multiple tiers to your segments for quick access to specific information. For instance, you could segment by division and then by status, like active and inactive. Or, segment stores by low sales performance and locations with overdue training. Multiple tiers enhance efficiency in accessing relevant data promptly.
SHOW PIN COUNT
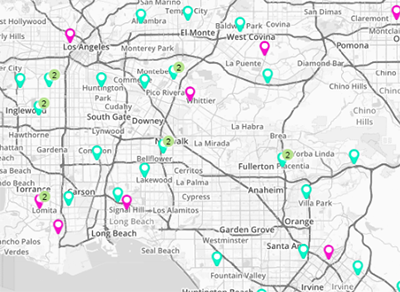
Turn on SHOW PIN COUNT if you want to see how many pins are in each segment (the pin count appears next to the Layer Folder). After you apply your settings, your segmentation tiers will appear in your map Layer menu. Toggle the segment folders on and off as needed.


Pro Tip: Every pin segment on your map will appear in its own unique color, showcasing the diversity of your data at a glance. Want to know which color corresponds to which segment? Just pop open your pin layer folder and check out all the subfolders tucked inside. Flip different layers on and off to unveil a variety of audience insights—it’s as simple and powerful as that!
LEVERAGE YOUR SEGMENTS
Now, it’s time to apply your segments and make them work for you! Here are some incredible ways businesses use segments to get the most out of their data:
- Targeted Marketing Campaigns: Use segments to tailor marketing efforts to specific customer groups, increasing the likelihood of engagement and conversion.
- Performance Analysis: Evaluate the performance of different product lines or services by creating segments based on key metrics, enabling strategic decision-making.
- Operational Efficiency: Streamline operations by creating segments that highlight bottlenecks or areas for improvement in the supply chain or service delivery.
- Risk Mitigation: Mitigate risks by segmenting data to identify vulnerabilities or areas prone to issues, allowing proactive measures to be implemented.
- Sales Territory Optimization: Optimize sales territories by segmenting based on factors like demographics, ensuring sales reps target the right audience with the right approach.


Pro Tip: Segments aren’t just for maps. Apply segments to your charts and BOOM! Watch as new data insights burst to life right before your eyes.


