BELGIUM REGIONS
- Territory Guide
- BELGIUM REGIONS
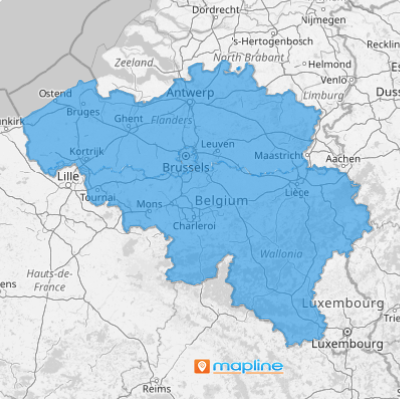
Make a map of Belgium regions a solid part of your analytics. Integrating these regions into your analytics is like equipping your sales team with a powerful new tool. If you’re finding it tough to crack into new markets, visualizing these detailed regional boundaries is a game-changer. This map enables you to gain a deeper understanding of your customer behavior, competitor performance, and other challenges that might otherwise slip through the cracks. Map out these regional divisions now to uncover insights that drive more strategic decisions and boost your market penetration efforts!
Create your Belgium region now and watch your sales skyrocket! Trust us, you don’t want to miss this!
WHAT ARE BELGIUM REGIONS?
Belgium’s regional territory is a unique puzzle with its Flemish, Walloon, and Brussels-Capital Regions each holding distinct characteristics. When you overlay these boundaries on a map alongside your data, it’s like adding a secret ingredient to your analytics recipe. This powerful visualization lets you see beyond the numbers, revealing actionable insights that can catapult your business to new heights. By understanding how each region impacts your performance, you can tailor your strategies with precision and drive your success forward.
Dive into the regional maps and watch your business soar!
ADD BELGIUM REGIONS
Imagine you operate a supply chain and aim to optimize your delivery routes. By adding Belgium regions to your map, you gain valuable clarity to craft impeccable plans for improved efficiency and cost-effectiveness of your operations. That’s so mind-blowing!
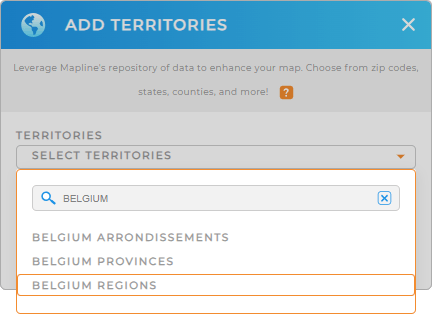
You can do that by adding a new territory from Mapline’s repository, simply type BELGIUM in the search bar and select BELGIUM REGIONS.
Now that you have added the right territory, let’s wrap up the last step and your map will be ready to go.


Pro Tip: Unlock the potential of Mapline’s worldwide territory repository including Belgium provinces, regions, and Belgium arrondissements. It’s a great way to sharpen your spatial analysis capabilities and capture diverse geographic insights tailored to your business.
CHOOSE REGION COLORS
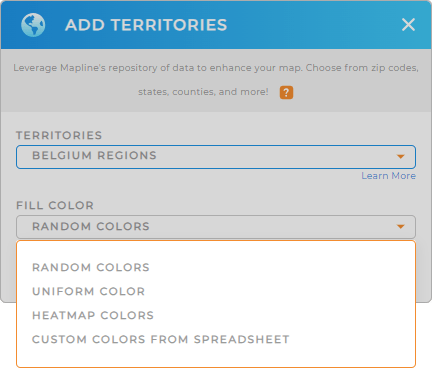
Now, let’s color code your map. Colors are crucial when analyzing data on a territory map, adding more clarity and impact to your visualizations. Here at Mapline, you’ll never run out of color styles to choose from! If you want the region boundaries to be easily recognizable, choose random colors. If you want to analyze customer concentrations or demand hotspots, you may want to apply heat map colors. If you want to match your brand colors, apply your custom colors from your spreadsheet.
Once you have configured your color styling, click OK and you’re done! You’ve successfully added Belgium regions to your map in under a minute. Enjoy your enhanced visualization and insights!

GET NEW TERRITORY INSIGHTS
Now, delve deeper into analyzing your Belgium region map by utilizing the following capabilities:
- Supercharge your efficiency with business intelligence
- Pivot your sales strategies when you add competitor locations to your map
- Effortlessly add new locations to existing dataset in seconds


