Quick Reference Guide
Maps: Territories
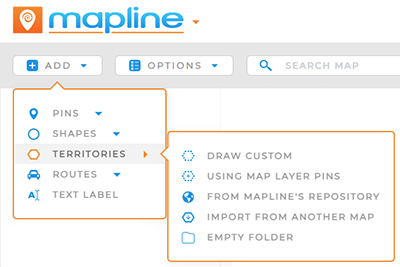
SELECT SOURCE
There are many different ways to add territories to your maps! Pull from different data sources to create the exact territories you need.
Choose from the following options to get started:
- DRAW CUSTOM: Draw your own territories on your map. This is ideal if you have custom territory boundaries or shapes you’d like to preserve.
- USE MAP LAYER PINS: Draw a territory around the pins contained in this map layer.
- MAPLINE’S REPOSITORY: Draw upon Mapline’s extensive territory database and enhance your map even further!
- FROM ANOTHER MAP: Import existing territories from any of your Mapline maps. This way, you never have to re-create territories!
- EMPTY FOLDER: Create an empty territory layer folder, to which you can later add custom shapes and territories.
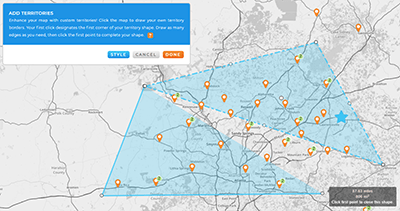
DRAW CUSTOM TERRITORIES
Do you have territories that don’t align with zip code or government boundaries? Draw any shape you need, no matter how irregular. As you drag your mouse, watch the distance in miles that appears in the black label next to your shape.
Once you have the right distance, click your mouse again to complete the shape.
Draw as many custom territories as you need in one go. Once you click Done, this series of territories becomes its own Layer Folder in your map sidebar.
Pro Tip: Territories appear as a new Layer Folder in your map sidebar.
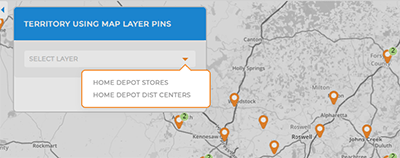
SELECT LAYER
First, choose from your existing pin layers. Any layer that contains pins can be used to auto-generate your territories.
Once you’ve selected the correct layer, buckle up– this is where things really get cool.
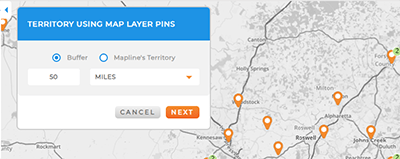
SELECT BOUNDARY TYPE
Toggle between the two different boundary options to configure your territory even further.
- BUFFER: Set a mile-radius buffer around your pins.
- MAPLINE’S TERRITORY: Contain this territory to one of Mapline’s pre-defined territories, such as a state or zip code boundary.
Did you catch that? This is such a powerful way to create custom territories around your existing map pins, in a way that’s truly tied to your data.
FROM MAPLINE’S REPOSITORY
Leverage Mapline’s extensive repository of pre-defined, worldwide territories. Select from:
- Area codes
- Census Tracts and Blocks
- Counties and County Subdivisions
- Countries
- Legislative and Congressional Districts
- Metropolitan Statistical Areas (MSAs)
- Postcode Areas and Districts
- Provinces
- Regions
- School Districts
- States
- Zip Codes
Once you’ve selected the territories you need, click ADD TERRITORIES TO and select your desired folder. Name your folder, then click OK to add the territory boundaries to your map.

Pro Tip: Explore our extensive Territory repository containing hundreds of worldwide territories, including any country, province, state, or county you can think of! It’s never been faster to map the precise territory boundaries you need.
FROM ANOTHER MAP
Don’t re-create the same territories over and over. Instead, import your existing territories in a few clicks, and BAM! You’re ready to analyze your data.
From the ADD menu, select TERRITORIES > IMPORT FROM ANOTHER MAP. Then, select your desired map and the territory group you’d like to add. When you’re done, click OK.
This is a great way to ensure accuracy across the board. Even if you have multiple different maps using different datasets, you can be certain that your territories are identical on every map.

Pro Tip: Once you’ve added the territories you need, custom style your territories! You can even base your territory styling on your data, so that any time your data changes, your maps update too. Check it out!