ECUADOR CANTONS
- Territory Guide
- ECUADOR CANTONS
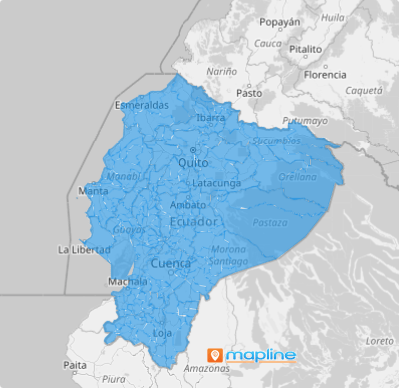
Harness the power of a map of Ecuador cantons to propel your business forward. Since cantons are smaller in size compared to provinces, viewing your data within these boundaries provides hyper-local insights that prompt you to reassess your business operations and make instant adjustments in areas with specific needs. Imagine effortlessly optimizing operations, seizing market opportunities, and leaving competitors in the dust. With Mapline, you’re not just mapping territories—you’re unlocking new possibilities and driving unstoppable success across Ecuador! How cool is that?
But first, let’s take you on a quick drive on how to add canton boundaries to your map in seconds.
WHAT ARE ECUADOR CANTONS?
Ecuador—a South American nation bursting with economic potential—is powered by its 221 cantons, the driving force behind local initiatives and progress. These dynamic regions shape the path toward a more sustainable and prosperous future.
This ever-evolving landscape is full of both opportunities and challenges for those driving local progress. The secret to navigating it all? A strategic map of Ecuador’s cantons. By visualizing your operations within these boundaries, what once seemed like complex geographic hurdles becomes a roadmap to decisive action and success.
ADD ECUADOR CANTONS
Mapping territories like Ecuador cantons in Mapline takes a few seconds. With your map in hand, you can unlock powerful insights—crafting targeted marketing campaigns, optimizing supply chains and distribution routes, and gaining a deeper understanding of your customers like never before.
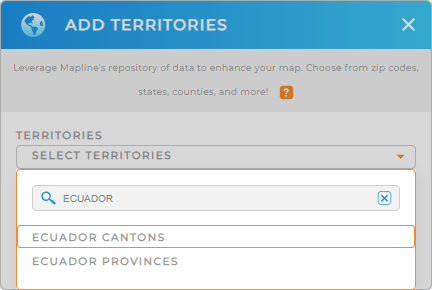
Start by adding a new territory from Mapline’s repository. Type ECUADOR into the search bar and select ECUADOR CANTONS.
Now that you’ve added Ecuador cantons, what’s next?


Pro Tip: Mapline’s worldwide repository of territory boundaries allows you to add precise regional divisions to your map. Add different regions, including Ecuador provinces and cantons, to compare and contrast different insights.
CHOOSE CANTON COLORS
Now, to add value to your map of Ecuador cantons, apply custom territory colors in just a few clicks. Mapline’s color style options make your territory map more functional as it extremely helps in extracting more valuable insights on your data analysis. If you want to understand geographic trends, choose dynamic color styling because they’re attached to your data.
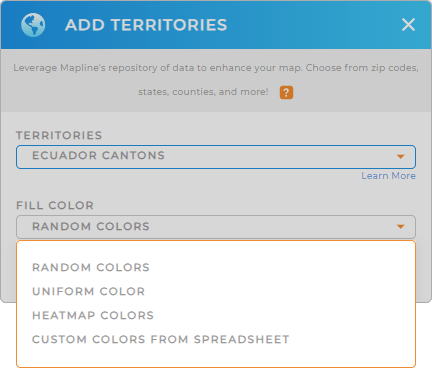
Go ahead and choose the color styles that match your analysis. From the drop-down menu, choose from random colors, uniform color, heat map colors, or custom colors.
Once you have configured your color setting, click OK to start digging in your map of Ecuador cantons.

GET NEW TERRITORY INSIGHTS
Apply these powerful capabilities to hone in on valuable insights in your data:
- Monitor inventory levels across different cantons to improve local marketing strategies
- Automate job assignments to ensure efficiency
- Track sales performance to close more deals


