- Blog
- Geo Mapping
- CREATE A MAP FROM A SPREADSHEET: FREE TOOLS THAT WORK
Need to create a map from a spreadsheet—fast? Whether you’re tracking sales, planning deliveries, or visualizing customer locations, mapping your Excel data can turn raw numbers into powerful insights. With Geo Mapping, you can create interactive maps in minutes—no coding or GIS experience required.
Why Create a Map from a Spreadsheet?
Mapping your spreadsheet data makes patterns visible at a glance. Instead of scanning rows in Excel, you can create a visual story of your business activities—making decisions faster, easier, and smarter.
Common use cases include:
- Create map of locations from Excel spreadsheet to visualize customers or assets
- Make a map from Excel data for performance reviews by region
- Create map with Excel data to analyze service areas and delivery zones
Geographic visuals help your team see what the numbers can’t—and Mapline makes it simple to create a map from excel spreadsheet data in seconds.

How to Create a Map from Excel Using Mapline
In Mapline, building maps from Excel is intuitive and fast. Here’s how to create a map from Excel or create a map with pins from Excel in under 5 minutes:
- Upload Your File: Drag your spreadsheet into Mapline. We support Excel (.xlsx) and CSV formats.
- Select Your Location Columns: Choose your address, city, state, or zip columns.
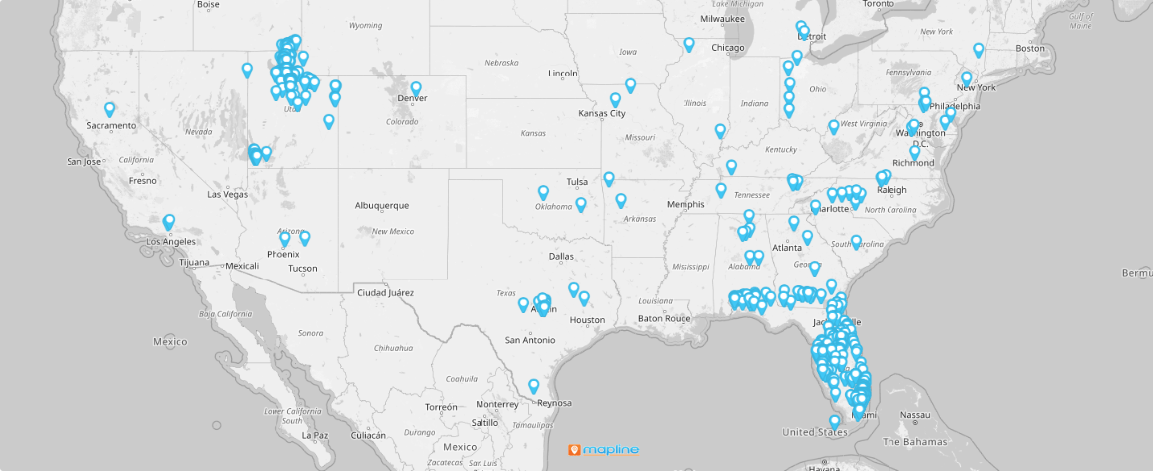
- Choose “Create Map”: Instantly generate a pin map using your spreadsheet data.
- Customize Your Pins: Use colors, labels, and grouping to make the data pop.
This method works whether you’re trying to build a map with pins, create pin map from Excel file, or simply map addresses from a spreadsheet.
Want a Heat Map Instead of Pins?
Want to visualize data density or performance trends? Use Mapline to create a heat map—without the Excel limitations.
While you technically can create a heat map in Excel, the process is limited and manual. Mapline simplifies it:
- Import your spreadsheet
- Click “Heat Map” instead of “Pins”
- Adjust intensity, radius, and color gradient
This is especially useful for analyzing sales clusters, delivery frequency, or customer saturation.
FAQs About Excel-Based Mapping
How do I create a map with pins from Excel?
Upload your spreadsheet to Mapline, select your location data, and click “Create Map.” You’ll instantly see a pin for each row of data.
Can you create a map in Excel?
Excel does offer basic mapping tools, but they’re limited and lack interactivity. Mapline is a far better solution for full-scale mapping.
How do I create an interactive map in Excel?
While it’s possible with VBA scripts and Power Map add-ons, it’s far easier to use Mapline for instant interactive maps with filtering and layers.
What’s the difference between building maps in Excel and using Mapline?
Excel maps are static and difficult to share. Mapline’s web-based interface lets you create, update, and share maps with your team in seconds.
Start Mapping for Free
You don’t need coding skills or complex GIS platforms to create beautiful, functional maps from your spreadsheet. Whether you want to create a map with pins from Excel, build a heat map, or just make a map from Excel data, Mapline helps you go from spreadsheet to insight—fast.
Try Mapline’s state-of-the-art map software today and experience how easy it is to create map from spreadsheet data that drives real business decisions.


