Our team is ready to help you eliminate wasted time, maximize your sales coverage, and supercharge your team's efficiency. We'll provide the expert guidance and tailored solutions you need to get things right. Stop missing out on valuable opportunities. Reach out, and we'll get started on optimizing your territories today!
READY FOR MAPLINE TO
ROCK
YOUR WORLD?
WE WANT YOU TO EXPERIENCE EVERYTHING! HOW WOULD YOU LIKE TO GET IN TOUCH SO WE CAN GET THINGS STARTED?
READY FOR MAPLINE TO
ROCK
YOUR WORLD?
Discover the potential of Mapline with a LIVE DEMO from our experts. This is your chance to see it in real-time and get all your questions answered. Connect with us to schedule your demo today!
Add government and administrative boundaries like ZIP codes, counties, states, and census tracts directly to your maps! This is a powerful way to organize and analyze geographic data faster. Visualize customer density, optimize territories, improve regional targeting, and uncover geographic trends in seconds. Combined with heat maps, dashboards, and CRM-integrated workflows, government boundary maps turn location data into actionable business intelligence.
How to Create a Government Boundary Map
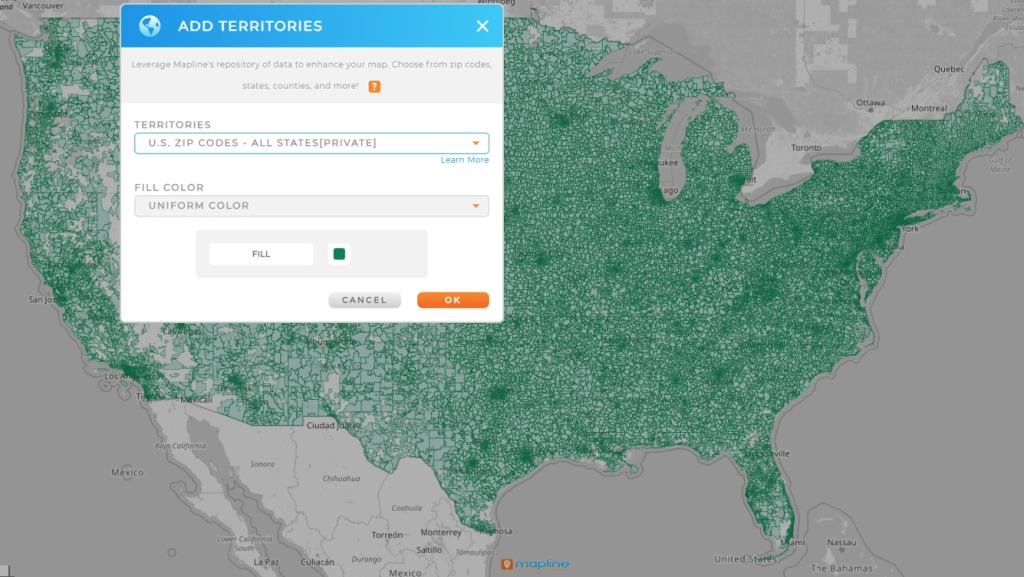
Mapline’s custom map maker lets you add government boutndaries in seconds. Simply open your map, add a new boundary layer, and select the administrative regions you want to visualize.
Select from built-in government boundaries such as ZIP codes, counties, states, census tracts, and school districts
Overlay boundaries directly onto existing maps alongside customers, territories, routes, or operational data
Filter, style, and customize regions instantly for clearer geographic analysis and operational visibility
Analyze Performance by Geographic Region
Overlaying administrative boundaries makes it easy to compare sales, operational performance, customer activity, or service coverage across real-world geographic regions. Instead of manually sorting spreadsheets, teams can instantly visualize which ZIP codes, counties, or states are performing best.
This helps you uncover geographic trends faster and make more informed regional decisions.
Pro Tip: Combining ZIP code boundaries with heat maps and customer density layers helps businesses uncover profitable expansion regions and operational gaps much faster than spreadsheets alone.
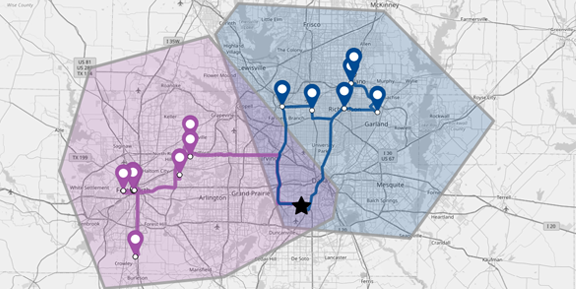
Optimize Territories With Prebuilt Boundaries
Use built-in government boundaries as a fast foundation for sales territories, franchise regions, service zones, or operational districts. This helps teams reduce territory overlap, improve territory efficiency, and streamline regional planning workflows.
Instead of manually drawing regions from scratch, businesses can organize operations around standardized geographic boundaries already built into Mapline.
Visualize Customer Density Across Regions
Boundary overlays make customer density analysis much easier to understand by grouping activity within clear geographic regions. Quickly identify underserved markets, high-demand regions, and areas with expansion potential.
Combined with heat maps and demographic data, customer density maps help teams improve regional targeting and uncover growth opportunities faster.
Layer Demographic Data Onto Maps
Administrative boundaries create a powerful framework for demographic analysis. Once you’ve added boundaries to your map, overlay population, income, household, and regional market data to better understand customer behavior and geographic demand.
This helps teams align operational planning, territory design, and marketing strategies with real-world demographic trends.
TURN GEOGRAPHIC DATA INTO BUSINESS INTELLIGENCE
Plot Locations
EASILY FROM A SPREADSHEET
VISUALIZE
YOUR DATA IN SECONDS
HEAT MAP
YOUR DATA AND UNCOVER KEY PATTERNS
CUSTOM TERRITORY
CREATION AND MANAGEMENT
INCREDIBLE STYLING
AND PIN GROUPING OPTIONS
WHICH TYPES OF GOVERNMENT BOUNDARIES ARE THERE?
ZIP Code Boundary Maps
Analyze customer density, sales performance, service coverage, and regional demand at a highly-actionable level. These maps are commonly used for territory planning, marketing analysis, operational reporting, and identifying underserved markets.
ZIP code maps also make it easier to improve regional targeting and uncover geographic growth opportunities faster.
Create County and State Territory Maps
Organize operations across larger geographic regions with county and state territory maps! Compare operational performance, customer activity, and territory coverage across multiple markets simultaneously.
This is especially useful for organizations managing distributed teams, multi-region operations, or large service territories.
Census and Demographic Regions
Census tracts and demographic boundaries empower you to visualize population, income, household, and market data directly on your maps. This creates a much clearer picture of customer behavior, market penetration, and regional opportunity.
Demographic maps help you align operational planning and growth strategies with real-world geographic demand.
School Districts and Municipal Areas
School districts, municipalities, and local administrative boundaries help you organize operations around real community regions. These maps are useful for regional outreach, service planning, public sector workflows, and localized operational analysis.
They also help teams standardize reporting and improve regional visibility across departments.
Combine Multiple Boundary Layers
Add multiple government boundaries to a single interactive map for deeper geographic analysis. Teams can compare ZIP codes, counties, territories, demographic regions, and customer activity simultaneously.
This helps uncover geographic relationships and operational patterns that are difficult to identify in spreadsheets alone.
Pro Tip: Combine demographic boundaries with customer density maps and operational data to quickly identify profitable expansion regions and underserved markets.
TRY OURHIGH-ACCURACYGEOGRAPHIC BOUNDARYMAPS
Improve Geographic Visibility Across Operations
Reduce Manual Territory Management
Skip the hassle of manually drawing and maintaining geographic regions. Prebuilt administrative boundaries help you organize territories faster using standardized ZIP codes, counties, states, and other government regions already built into Mapline.
This helps reduce operational inefficiencies while keeping regional reporting and territory management consistent across teams.
Uncover Geographic Trends Faster
Visualize operational performance within real-world geographic regions to quickly spot customer clusters, underserved markets, territory gaps, and regional demand patterns. Interactive boundary maps make geographic trends instantly visible instead of buried inside spreadsheets.
This helps you make faster, more informed decisions around expansion, territory planning, and operational coverage.
Improve Regional Targeting Strategies
Align sales, marketing, and operational strategies with real geographic demand by analyzing performance across ZIP codes, counties, or demographic regions. Boundary overlays help you identify which regions perform best and where additional opportunities exist.
This improves market penetration analysis and helps uncover profitable expansion regions faster.
Streamline Geographic Reporting Workflows
Organize operational data into clear geographic regions to simplify reporting across teams. Interactive dashboards and boundary maps make it easier to monitor regional performance, compare territories, and share geographic insights organization-wide.
This improves operational visibility while reducing time spent manually analyzing spreadsheets and disconnected reports.
Optimize Service Coverage Areas
Identify overlapping regions, disconnected service zones, and inefficient territory coverage using interactive boundary maps. Geographic visibility helps you streamline operations, reduce windshield time, and improve regional efficiency.
This creates a clearer operational picture and helps teams optimize coverage without increasing complexity.
Pro Tip: Overlay customer density maps, demographic data, and administrative boundaries together to quickly identify high-opportunity regions and operational blind spots.
CREATE A MAP THAT MOVES WITH YOU
WHATMAKES MAPLINE SODIFFERENT
SIMPLEST MAPPING SOLUTION
Plot multiple locations from Excel in seconds.
No coding, no setup—just copy, paste, and go.
Mapline makes it effortless to build custom maps with pins that transform your spreadsheets into visual insights you can act on immediately. Plot multiple locations from Excel in seconds.
No coding, no setup—just copy, paste, and go.
Mapline makes it effortless to build custom maps with pins that transform your spreadsheets into visual insights you can act on immediately.
POWERFUL MAP-BASED ANALYTICS
Mapline isn’t just a map tool— it’s a full-suite analytics platform.
Create a map, layer on territories, analyze performance, and automate workflows that help your business move faster.
Every map you create becomes a data-powered decision engine. Mapline isn’t just a map tool— it’s a full-suite analytics platform.
Create a map, layer on territories, analyze performance, and automate workflows that help your business move faster.
Every map you create becomes a data-powered decision engine.
Don’t just take our word for it:
“If you’re an advertiser, you want to know the markets I’m in. So, what am I going to do? Print out a spreadsheet? No, of course not. I’m going to use Mapline.”
– Sam Anthony, Your News
“I’m able to get a very complex, very deep and profound analysis.”
– Juan Hernández, RE/MAX
“Thank you Mapline for such an AMAZING program that is saving us money and building confidence in our future growth!”
– Lydia Rogers, Greenworks Commercial
“When people see it, they believe it. I show potential affiliates the map to start, just to show them how many markets we’re in and how we’re expanding.”
Government boundaries are predefined geographic regions such as ZIP codes, counties, states, census tracts, municipalities, and school districts used to organize and analyze geographic data.
Administrative boundary maps overlay geographic regions onto interactive maps, allowing you to visualize customer data, operational performance, territories, and demographic trends within real-world geographic areas.
Government boundaries help you organize geographic data into meaningful regions, making it easier to analyze performance, optimize territories, improve regional targeting, and uncover geographic trends faster.
Yes. Mapline allows you to overlay ZIP code boundaries, county lines, state regions, census tracts, and other administrative boundaries directly onto interactive maps.