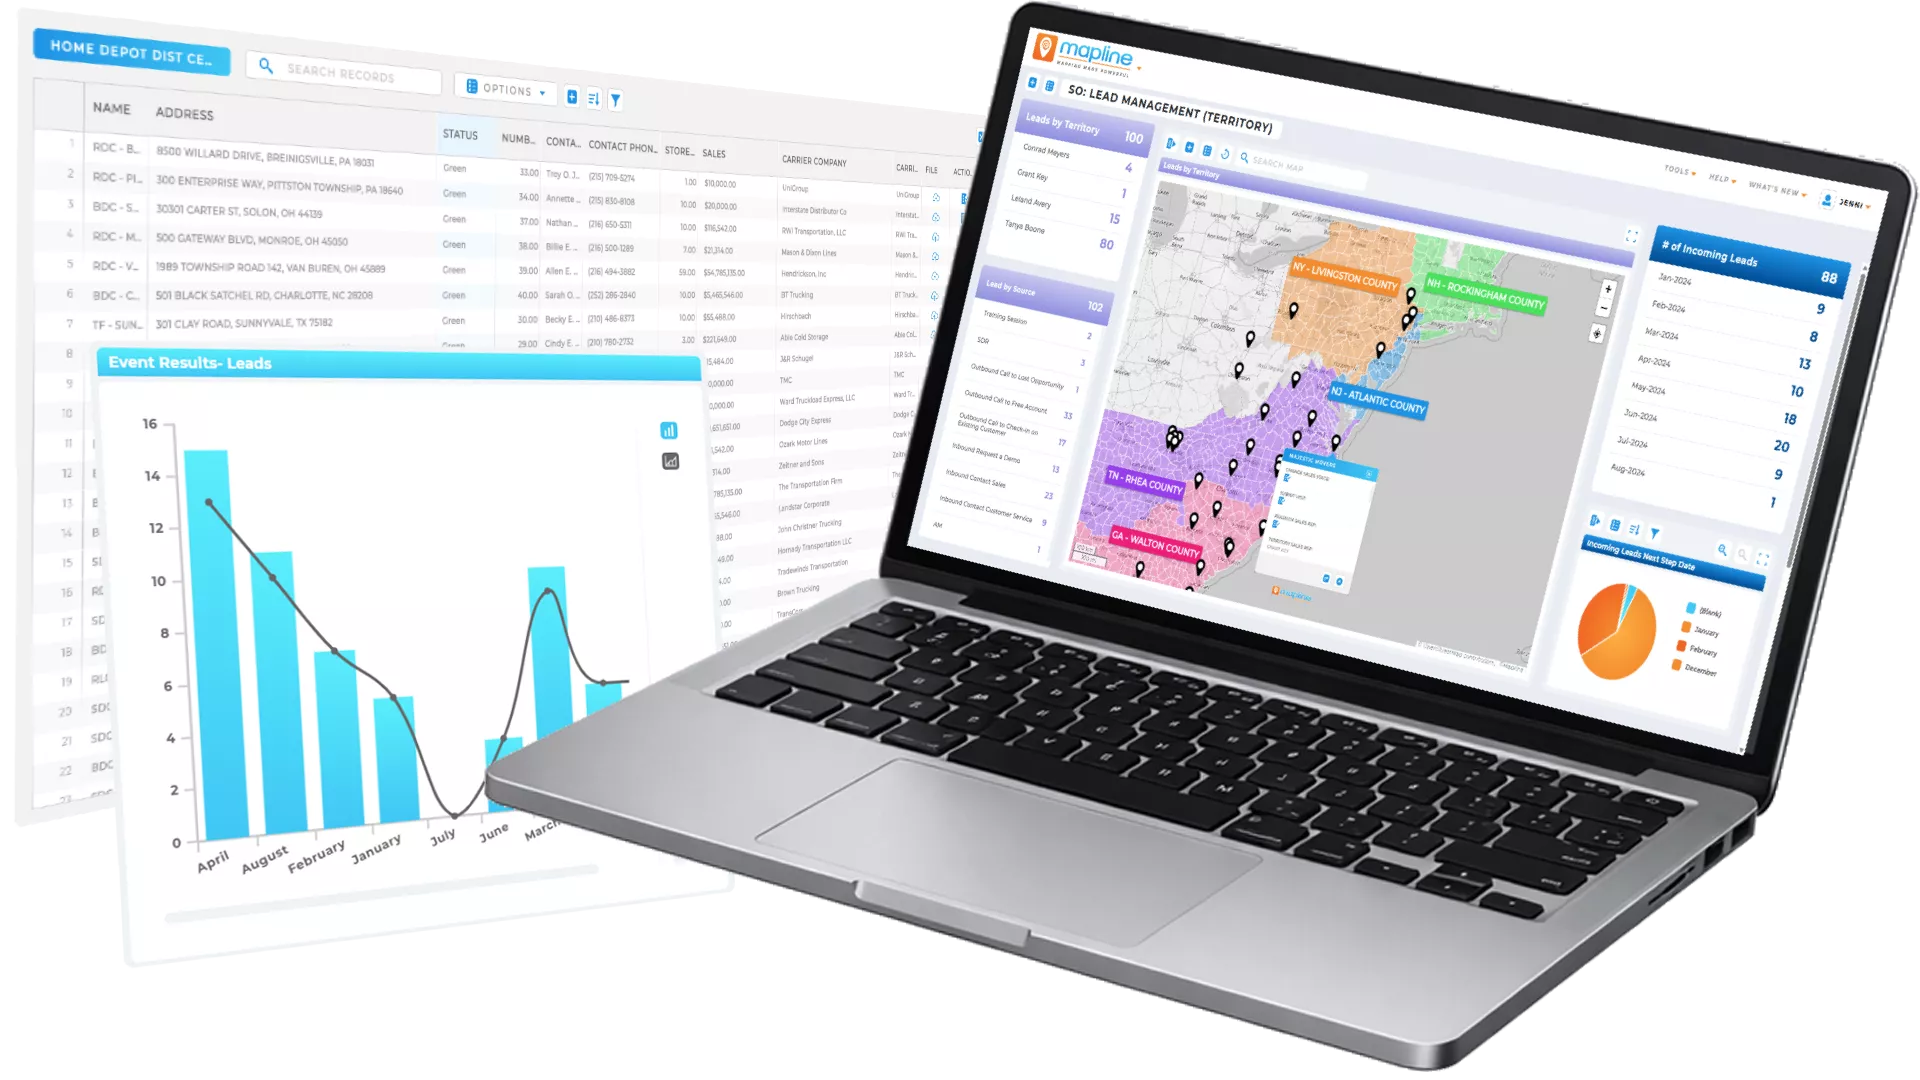
Our team is ready to help you eliminate wasted time, maximize your sales coverage, and supercharge your team's efficiency. We'll provide the expert guidance and tailored solutions you need to get things right. Stop missing out on valuable opportunities. Reach out, and we'll get started on optimizing your territories today!
READY FOR MAPLINE TO
ROCK
YOUR WORLD?
WE WANT YOU TO EXPERIENCE EVERYTHING! HOW WOULD YOU LIKE TO GET IN TOUCH SO WE CAN GET THINGS STARTED?
READY FOR MAPLINE TO
ROCK
YOUR WORLD?
Discover the potential of Mapline with a LIVE DEMO from our experts. This is your chance to see it in real-time and get all your questions answered. Connect with us to schedule your demo today!
Upload custom images for pin icons to make maps more intuitive, engaging, and meaningful. Replace standard map pins with logos, product images, facility types, team photos, property images, or any custom visual that helps communicate information more clearly.
Custom image icons make it easier to identify locations at a glance, improve map readability, and create more visually compelling geographic experiences for teams, customers, and stakeholders.
How to Upload Images for Pin Icons
Upload custom images directly into Mapline and assign them as map pin icons. Use a single image across all locations or dynamically display different images based on the data in your spreadsheet.
This allows you to create highly visual maps without requiring design or GIS expertise.
Differentiate Locations More Clearly
Replace generic pins with meaningful images that immediately communicate what each location represents. Use custom icons for stores, facilities, customers, assets, service locations, franchise locations, or operational sites.
This reduces confusion and makes maps easier to interpret.
Pro Tip: Use color-coded pins to segment your data—for example, green for top-performing regions, red for underperforming ones. This makes performance insights instantly visual and actionable.
Showcase Products and Assets Visually
Display product images, equipment photos, property images, vehicles, or inventory items directly on the map. Visual icons provide additional context that helps teams understand location data more quickly.
This improves operational visibility and simplifies geographic analysis.
Reinforce Brand Identity Across Maps
Use company logos, branded icons, and custom imagery to create a more professional map experience. Consistent branding helps improve presentations, customer-facing maps, dashboards, and internal reporting.
This creates a more polished and recognizable visual experience.
Analyze, Filter, and Segment
Once your map is created, you’re in control. Segment your pins by region, sales rep, or performance level using filters and color groups. Combine your map with territories, boundaries, or demographic data to uncover deeper insights about your customers or markets.
Example use cases:
Sales teams analyzing leads by region or rep
Field service managers tracking technician locations
Operations teams mapping supplier or warehouse networks
Marketing teams visualizing customer density
TURN YOUR DATA INTO A COMPETITIVE EDGE
Plot Locations
EASILY FROM A SPREADSHEET
VISUALIZE
YOUR DATA IN SECONDS
HEAT MAP
YOUR DATA AND UNCOVER KEY PATTERNS
CUSTOM TERRITORY
CREATION AND MANAGEMENT
INCREDIBLE STYLING
AND PIN GROUPING OPTIONS
WHICH TYPES OF PIN MAPS ARE THERE?
Single-Layer Pin Map
A single-layer pin map is perfect for quick visualizations. Upload your Excel or CSV file and instantly plot every location on the map using one consistent pin style. This type of map helps you see the big picture—like customer distribution, service coverage, or store locations—without distractions. It’s simple, clear, and ideal for presentations or internal reports. Think of it as your fast, high-level view of what’s happening across your business footprint.
Color-Coded Pin Map
A color-coded pin map lets you highlight differences in your data using color. For example, you can color pins by region, sales performance, customer type, or rep assignment. This makes it easy to identify trends, compare categories, and spot outliers instantly. Color-coded pin maps are especially useful for sales teams tracking performance or marketers analyzing engagement by area. With a quick glance, you’ll know which areas are thriving and which ones need attention.
Segmented Pin Map
Segmented pin maps take customization further by grouping pins into layers or data segments. You can toggle layers on and off to focus on specific types of data—like customers vs. competitors, or active vs. inactive accounts. This structure keeps your map clean and interactive, helping you explore relationships between datasets without losing context. It’s an incredibly efficient way to make complex data sets easy to understand and act on.
Labeled Pin Map
Labeled pin maps display key information directly on each pin—such as location names, revenue totals, or assigned team members. This eliminates the need to cross-reference spreadsheets and gives your team quick context while reviewing performance or planning routes. For example, operations managers can see delivery zones labeled by driver, while executives can scan top-performing stores at a glance. Labels make your map as informative as it is visual.
Pro Tip: Color-coded and labeled pin maps can be used together for maximum clarity. Add color to represent performance and labels to show values—like revenue or workload—so you can see patterns and opportunities side by side.
TRY OURLIGHTNING-FASTPIN MAPGENERATOR
Pin Maps Uncover insights that drive real results—fast.
Advanced Pin Styling and Customization
Mapline gives you the freedom to style your maps exactly how you need them. Choose from color-coded pins, icons, shapes, or even upload your own custom images for brand consistency. Add dynamic labels that display key metrics like revenue, rep name, or status directly on the pin. With full styling control, your map becomes both visually clear and context-rich—no legend or guesswork required.
Bulk Pin Management and Instant Rendering
While other platforms slow down with large datasets, Mapline handles thousands of pins with ease. Upload massive Excel or CSV files, and your locations appear on the map instantly. Use grouping, filtering, and clustering to simplify complex data and keep your maps clean and high-performing. Whether you’re mapping a few hundred or a few hundred thousand points, Mapline’s engine is built to handle it—fast.
Automatic Boundary and Territory Overlays
Mapline automatically syncs your pins with real-world administrative boundaries like ZIP codes, counties, or sales territories. This lets you analyze location data in context—seeing not just where your pins are, but what regions they belong to. You can even assign pins to territories automatically, saving hours of manual sorting. It’s precision mapping that connects the dots between your data and geography.
Distance and Proximity Calculations
Go beyond visualization with Mapline’s built-in distance tools. Instantly measure how far pins are from one another or from a specific location, helping you plan routes, balance territories, and evaluate regional reach. You can even set radius zones to identify customers within a specific distance of a store, warehouse, or office. It’s location intelligence made visual and immediate—no complex formulas required.
Multi-Layer Mapping and Data Overlays
Mapline allows you to stack multiple datasets onto the same map for deeper insights. Layer customer pins alongside competitor locations, supplier networks, or store footprints to see how your data interacts in real space. Toggle datasets on and off for clarity, or analyze overlaps to uncover new growth opportunities. It’s the clearest way to see how different parts of your business fit together geographically.
Pro Tip: Combine pin maps with boundaries or radius overlays to turn static visuals into true business insights. You’ll not only see where your customers are—but understand their proximity to your key markets, competitors, and opportunities.
CREATE A MAP THAT MOVES WITH YOU
WHATMAKES MAPLINE SODIFFERENT
SIMPLEST MAPPING SOLUTION
Plot multiple locations from Excel in seconds.
No coding, no setup—just copy, paste, and go.
Mapline makes it effortless to build custom maps with pins that transform your spreadsheets into visual insights you can act on immediately. Plot multiple locations from Excel in seconds.
No coding, no setup—just copy, paste, and go.
Mapline makes it effortless to build custom maps with pins that transform your spreadsheets into visual insights you can act on immediately.
POWERFUL MAP-BASED ANALYTICS
Mapline isn’t just a map tool— it’s a full-suite analytics platform.
Create a map, layer on territories, analyze performance, and automate workflows that help your business move faster.
Every map you create becomes a data-powered decision engine. Mapline isn’t just a map tool— it’s a full-suite analytics platform.
Create a map, layer on territories, analyze performance, and automate workflows that help your business move faster.
Every map you create becomes a data-powered decision engine.
Don’t just take our word for it:
“If you’re an advertiser, you want to know the markets I’m in. So, what am I going to do? Print out a spreadsheet? No, of course not. I’m going to use Mapline.”
– Sam Anthony, Your News
“I’m able to get a very complex, very deep and profound analysis.”
– Juan Hernández, RE/MAX
“Thank you Mapline for such an AMAZING program that is saving us money and building confidence in our future growth!”
– Lydia Rogers, Greenworks Commercial
“When people see it, they believe it. I show potential affiliates the map to start, just to show them how many markets we’re in and how we’re expanding.”