Made Visual:
- Blog
- Geo Mapping
- Customer Behavior Made Visual: The Business Case for Heat Map Tools
Understanding customer behavior is no longer just a marketing advantage—it’s a business imperative. Every purchase, click, and visit holds valuable clues about who your customers are and what they want. But spreadsheets and static reports often fail to deliver the clarity you need to act. That’s where a heat map generator can radically transform the way your team works. By turning raw data into dynamic, color-coded visuals, heat maps make it easy to see customer patterns in real-time.
From foot traffic to digital engagement, heat mapping helps teams pinpoint high-activity zones, identify trends, and respond quickly to changes in consumer behavior. Whether you’re optimizing a store layout, refining ad targeting, or expanding into new markets, visual tools remove the guesswork and let your data speak for itself. In this post, we’ll explore how Mapline’s location intelligence platform uses heat maps to make customer behavior visible—and actionable.
Unlock Hidden Patterns in Customer Behavior
Customer behavior often hides in plain sight. You may have the data—purchases, visits, loyalty points—but unless it’s visualized, you’re working in the dark. A heat map generator solves this by visually clustering behavior data across regions, stores, or even website sessions. The result? Patterns you can’t unsee. These maps offer a bird’s-eye view of how and where your customers are engaging, revealing insights that spreadsheets simply can’t.
With Mapline, you can apply customer behavior analysis to everything from in-store activity to delivery routes. Heat maps let you quickly identify what areas need more attention, what’s working well, and where consumer habits are shifting. This clarity empowers your team to move faster, test smarter, and deliver better experiences across every touchpoint.
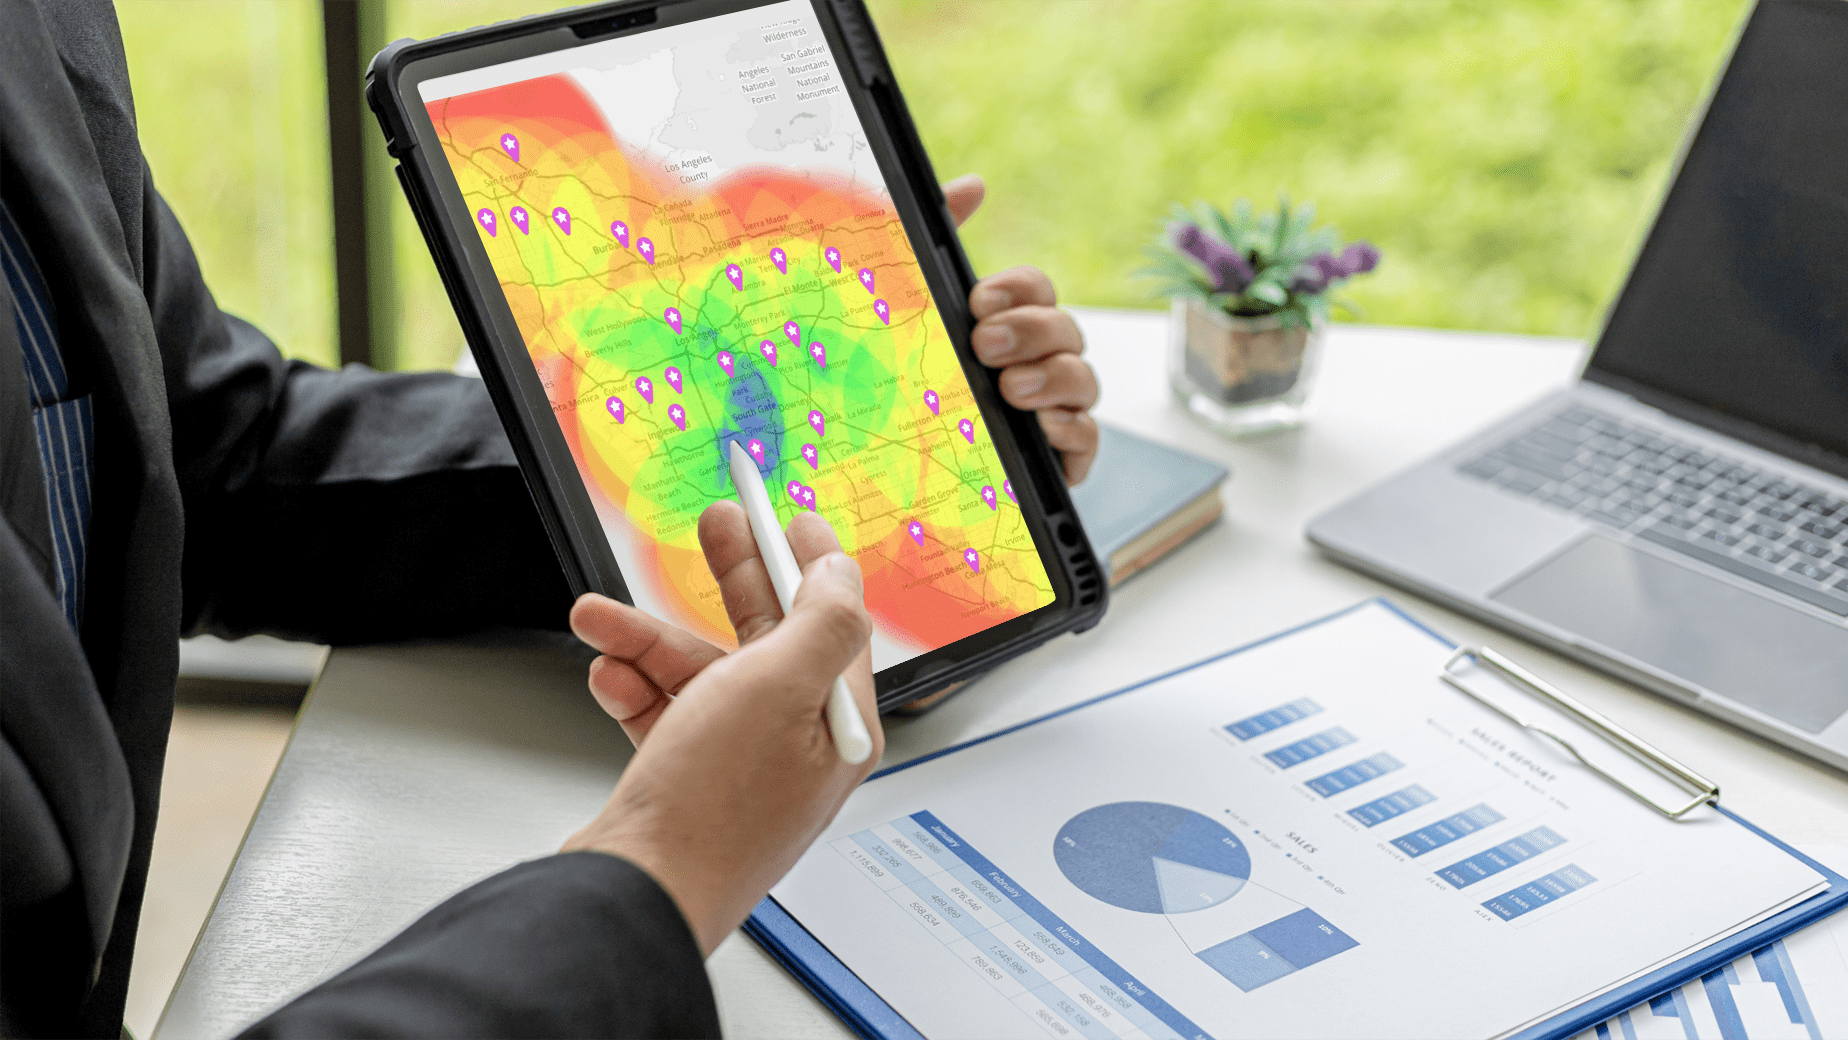

Pro Tip: Want to turn your customer data into a visual decision-making tool? Mapline’s Geo Mapping platform lets you create dynamic heat maps that track behavior, highlight trends, and guide strategy in real time. Start visualizing customer behavior with just a few clicks.
Track Customer Location Patterns in Real Time
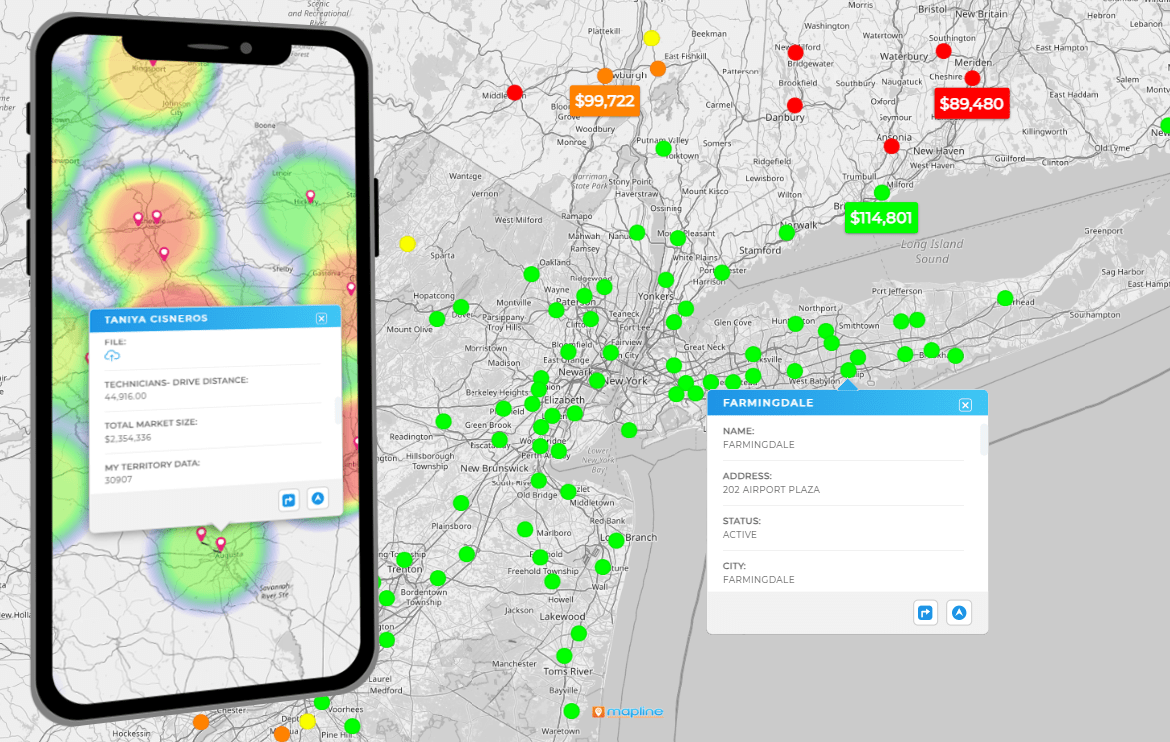
Behavioral trends shift daily—and understanding customer location patterns can help you stay ahead of those shifts. Mapline lets you map customer addresses, check-ins, or delivery drop-offs to visualize movement and density.
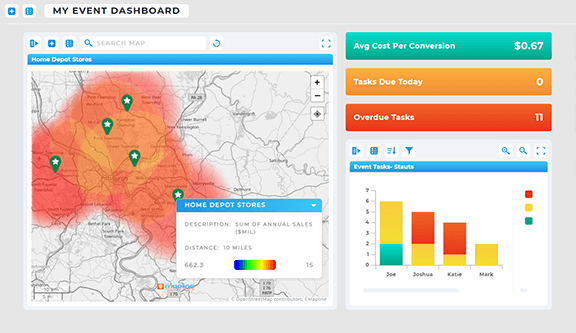
Identify Behavior Clusters and Drop-Off Zones
With gradient-style heat maps, you can easily spot engagement clusters and disengagement zones. These indicators often highlight overlooked sales opportunities or service gaps.
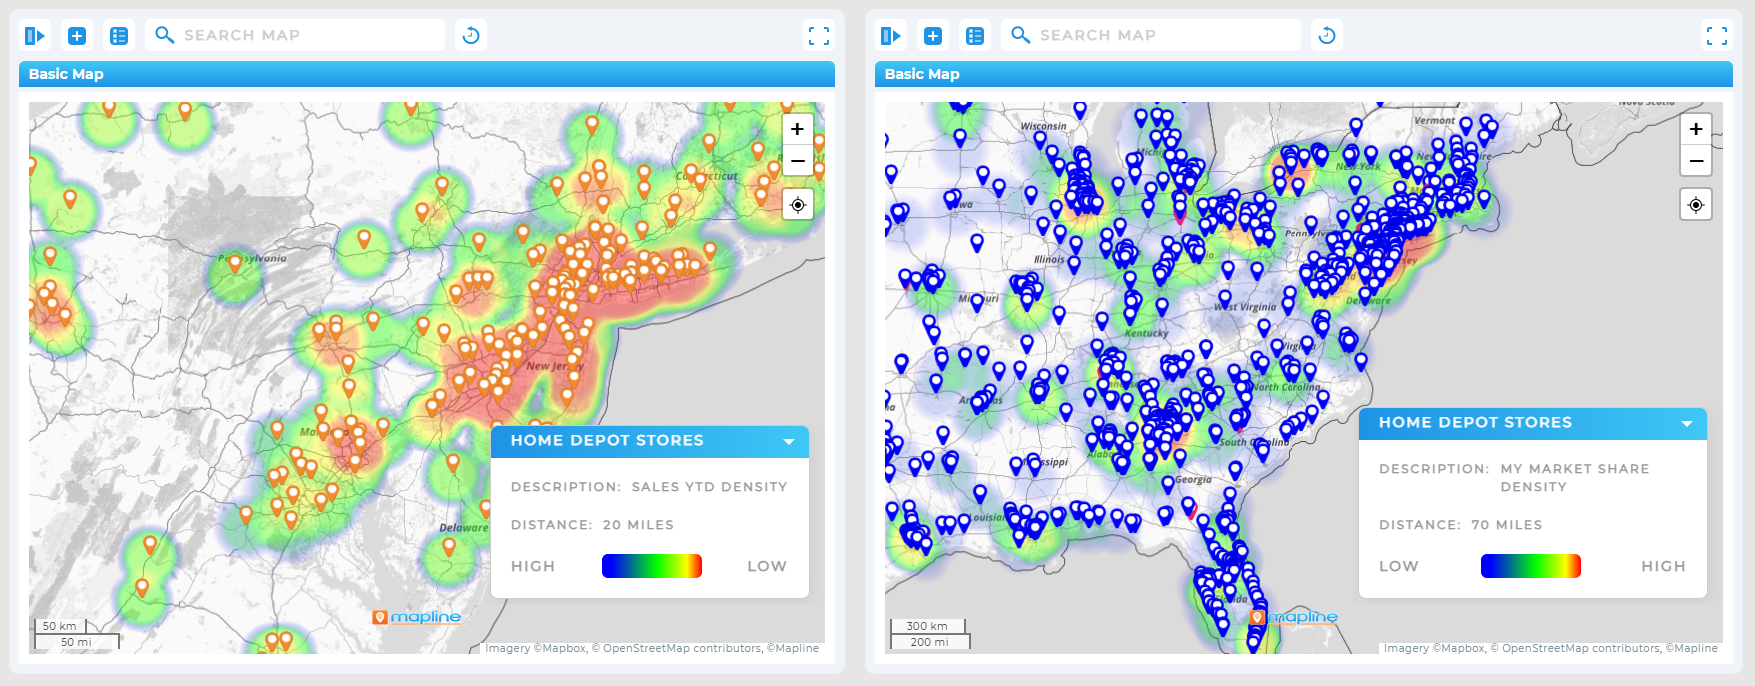
React to Behavioral Shifts Quickly
With real-time data syncs, your team can adjust outreach, staffing, or inventory in response to customer behavior as it changes—rather than weeks later.
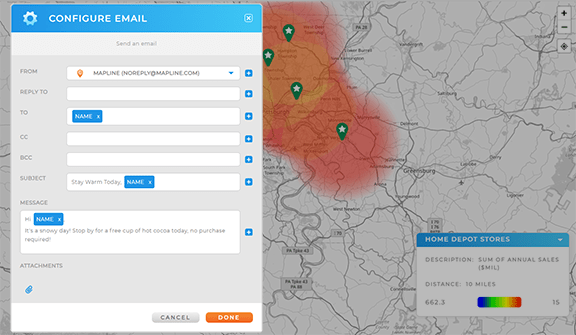
Visual Data Tools That Speak Everyone’s Language
Data silos and complicated dashboards slow down decision-making. What teams need is a shared language—and visual data is that language. A heat map is immediately understandable to executives, analysts, marketers, and field teams alike. Using Mapline’s visual data tools, teams across your business can collaborate around real-world customer insights, creating alignment and accountability without wasting time decoding raw numbers.
In fast-moving industries, this type of clarity can be the difference between proactive strategy and reactive clean-up. Instead of getting lost in pivot tables, your team gets focused answers—like where to host an event, which regions are lagging in engagement, or where to send extra sales support next quarter.
Make Customer Data Intuitive for Every Team
Mapline’s heat maps simplify data presentation so that even non-technical teams can understand and act on customer engagement analytics without delay.
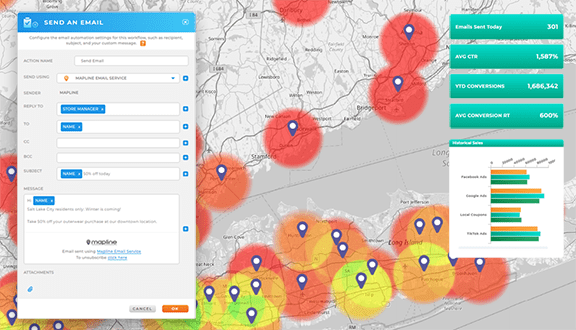
Replace Spreadsheets with Visual Snapshots
Instead of long reports, share instant visuals with stakeholders. Mapline makes it easy to export or embed maps in internal presentations and strategy decks.
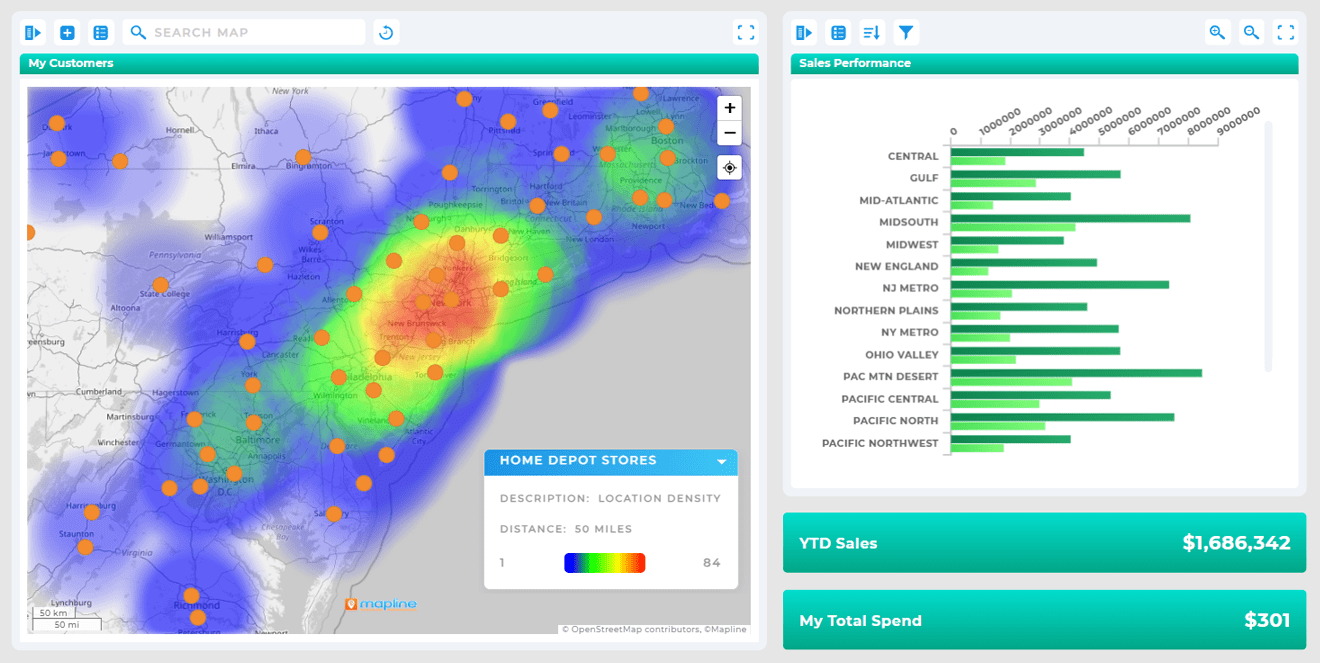
Strengthen Cross-Team Collaboration
When everyone sees the same map, alignment improves. Whether you’re in sales, marketing, or operations, behavioral heat maps build shared understanding across teams.

Power Better Retail and Consumer Trend Decisions
Retailers and B2C companies rely on a nuanced understanding of consumer behavior. Mapline’s tools make consumer trends mapping and retail data visualization simple and scalable. From tracking store visits and footfall to visualizing online orders by delivery region, Mapline lets you break down massive datasets into digestible, actionable visuals.
This isn’t just about pretty maps—it’s about identifying demand surges, low-engagement regions, or demographic outliers. You can track how different campaigns perform geographically, which stores have the highest conversion rates, or where customer interest is starting to taper off. All of this supports faster experimentation, localized marketing strategies, and smart expansion planning.
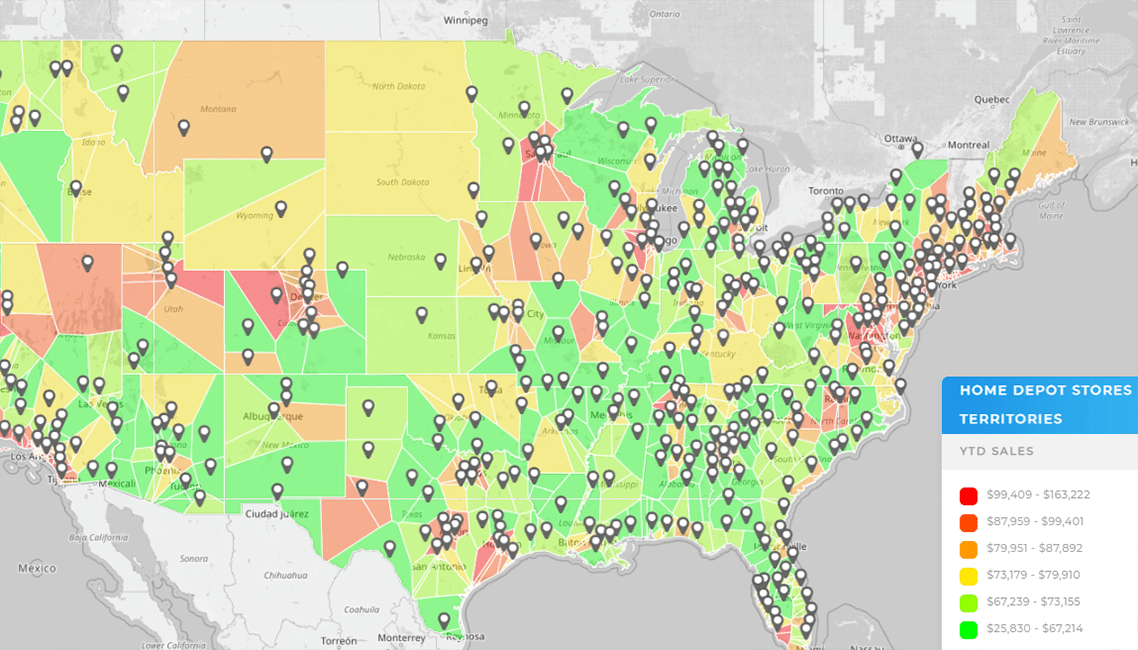
Analyze Regional Sales Trends and Loyalty Patterns
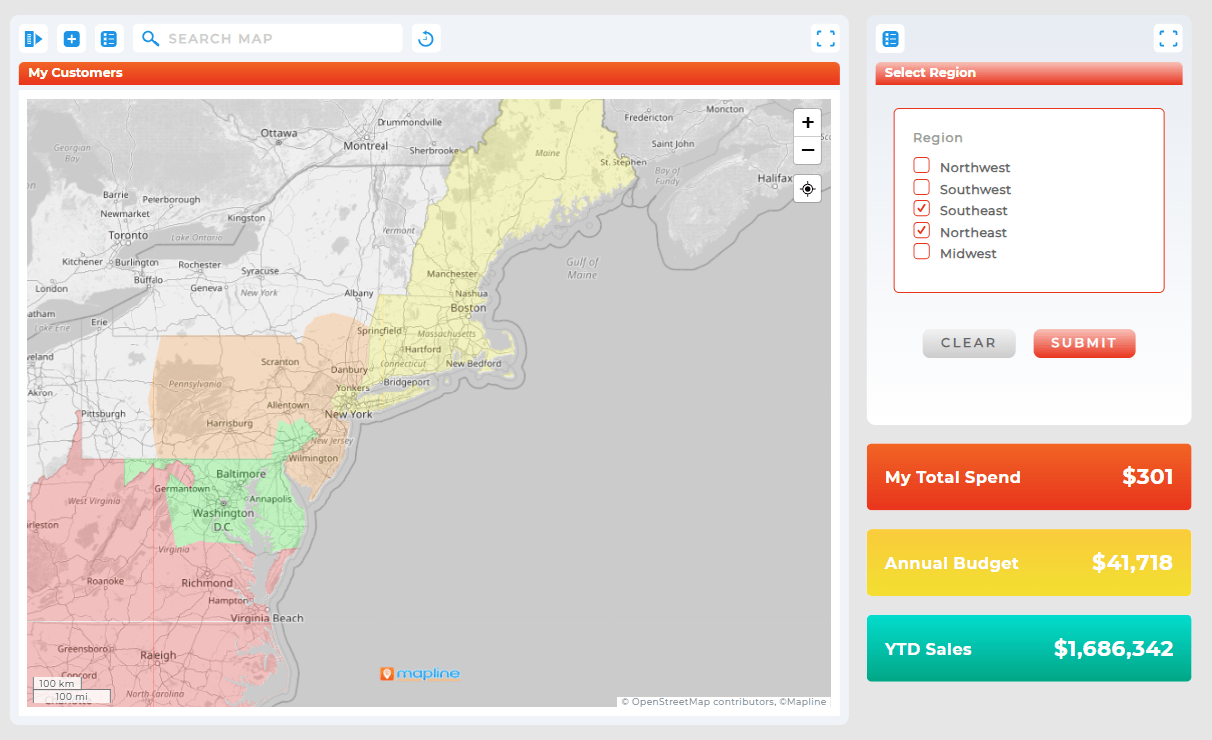
With sales trend heat maps, you can visualize purchases by product category, customer type, or time period to better understand regional buying behavior.
Compare Customer Engagement by Location
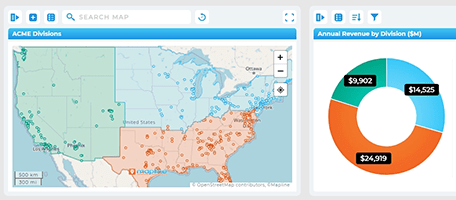
Mapline allows side-by-side comparisons of customer activity across cities or stores—perfect for franchise operators or regional marketing teams.
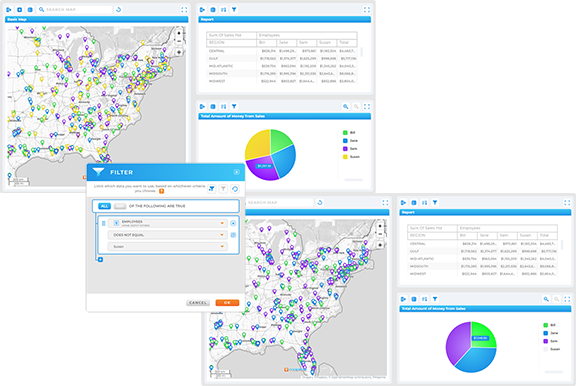
Guide Expansion Based on Real Behavioral Data
Instead of expanding based on assumptions, use geospatial visualization tools to confirm demand in new markets or neighborhoods before making major investments.
Move From Insight to Action With Mapline’s Tools
It’s not enough to know what’s happening—you have to act on it. That’s where Mapline’s full platform comes in. In addition to heat maps, you get access to robust territory management, data layering, and route optimization tools. When paired with behavioral heat maps, these features help you execute smart strategy at scale. You can reassign reps, launch promotions, or adjust distribution without delay.
Our geospatial visualization tools integrate seamlessly with your existing datasets and give you the flexibility to run what-if scenarios, apply filters, and forecast outcomes. With custom filters and automated data updates, your business can maintain a live pulse on customer behavior—and pivot with precision when it matters most.
Filter by Behavior Type or Data Source
Isolate purchase behavior, foot traffic, digital clicks, or app activity—Mapline lets you filter your view to get the clearest picture possible.
Share and Automate Live Maps Across Teams
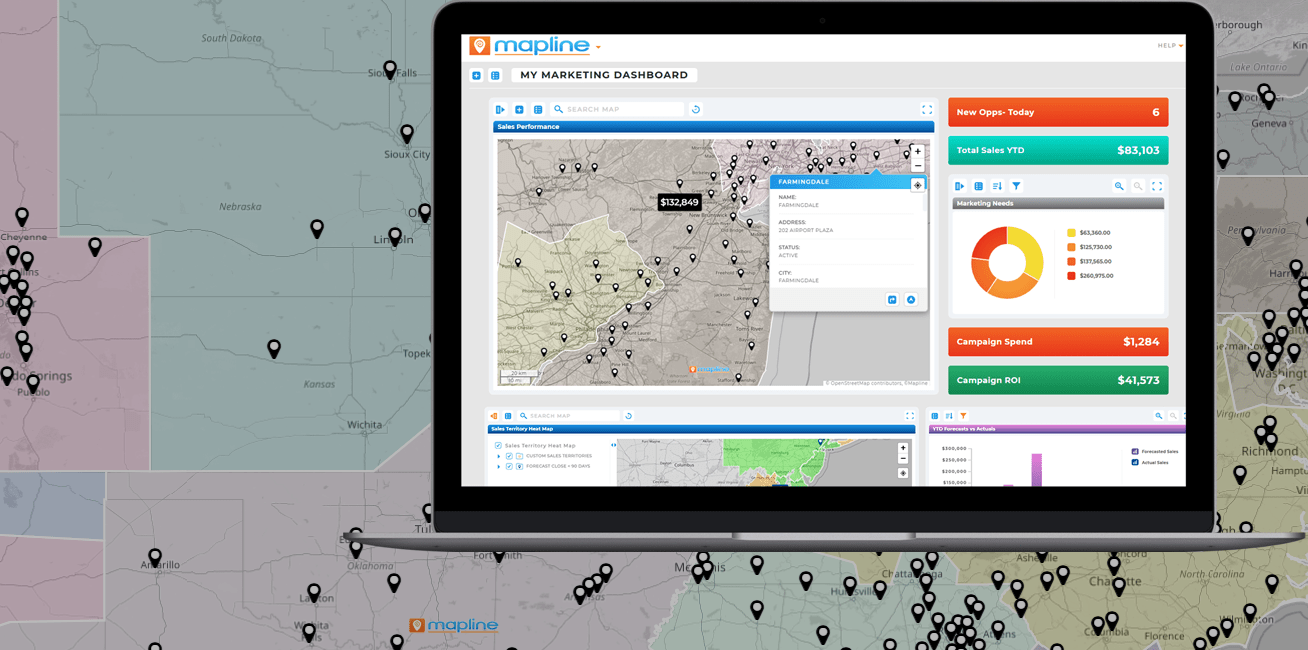
Create dashboards that update automatically and share them with stakeholders for full visibility and accountability.
Connect Customer Behavior to Operational Strategy
Tie heat map insights directly to staffing plans, inventory distribution, or promotional efforts. Visual behavior data becomes operational fuel.
It visually shows where customer activity is happening, helping you identify patterns, engagement zones, and behavioral shifts over time.
Yes! You can map e-commerce data like logins or purchases alongside retail data like visits or check-ins—Mapline supports multiple sources.
Absolutely. They help marketers focus efforts on high-engagement areas and adjust targeting based on real customer interactions.
Retail, logistics, B2C services, franchise brands, healthcare, and any business that serves customers across multiple locations.
No coding required. Mapline is built for business users who want powerful insights without technical complexity.


