Our team is ready to help you eliminate wasted time, maximize your sales coverage, and supercharge your team's efficiency. We'll provide the expert guidance and tailored solutions you need to get things right. Stop missing out on valuable opportunities. Reach out, and we'll get started on optimizing your territories today!
READY FOR MAPLINE TO
ROCK
YOUR WORLD?
WE WANT YOU TO EXPERIENCE EVERYTHING! HOW WOULD YOU LIKE TO GET IN TOUCH SO WE CAN GET THINGS STARTED?
READY FOR MAPLINE TO
ROCK
YOUR WORLD?
Discover the potential of Mapline with a LIVE DEMO from our experts. This is your chance to see it in real-time and get all your questions answered. Connect with us to schedule your demo today!
Create radius circle maps to visualize geographic coverage, drive distance, service areas, customer proximity, and regional reach around any location. Radius maps help you quickly understand how far customers, territories, facilities, stores, or operational regions extend geographically.
Instead of manually estimating distances or coverage zones, instantly generate interactive radius circles around locations to analyze market reach, optimize service coverage, improve territory planning, and uncover geographic gaps. Combine radius maps with territories, customer density, routes, and demographic data to make faster, more informed operational decisions.
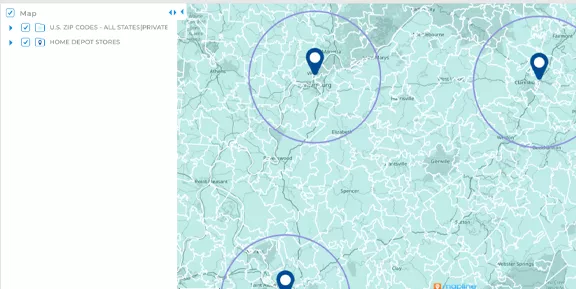
How to Create a Radius Circle Map
Create radius circles around any location in just a few clicks. Simply select a point on the map, define the distance or drive radius you want to analyze, and instantly generate interactive coverage areas.
This helps you visualize geographic reach faster without manually calculating distances or drawing regions by hand.
Analyze Service Coverage More Accurately
Visualize how far your teams, stores, facilities, or service regions extend geographically using radius-based coverage maps. Radius circles help identify underserved areas, overlapping regions, and operational gaps more clearly.
This improves territory planning and helps optimize regional coverage strategies.
Pro Tip: Combine radius circles with customer density maps, heat maps, and demographic overlays to quickly identify high-opportunity regions and optimize service coverage more effectively.
Identify Customers Within Specific Distances
Quickly analyze which customers, leads, accounts, or operational locations fall within a specific radius of a store, warehouse, office, or service center. Radius analysis helps you better understand geographic proximity and customer accessibility.
This supports smarter targeting, routing, and operational planning decisions.
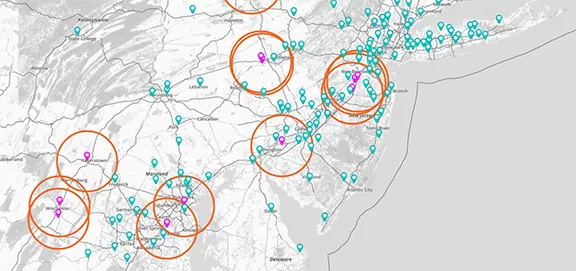
Compare Market Reach Across Locations
Generate multiple radius circles to compare market coverage between stores, territories, service hubs, or operational facilities. Visual comparisons make it easier to evaluate geographic reach and identify expansion opportunities.
This helps uncover regional inefficiencies and improve strategic planning.
Improve Site Selection and Expansion Planning
Use radius maps to evaluate how far locations can realistically serve surrounding customers and regions. Visualize geographic accessibility, nearby demand, and regional overlap before opening new facilities or expanding operations.
This helps reduce geographic uncertainty and supports more informed expansion decisions.
VISUALIZE GEOGRAPHIC REACH STRATEGICALLY
Plot Locations
EASILY FROM A SPREADSHEET
VISUALIZE
YOUR DATA IN SECONDS
HEAT MAP
YOUR DATA AND UNCOVER KEY PATTERNS
CUSTOM TERRITORY
CREATION AND MANAGEMENT
INCREDIBLE STYLING
AND PIN GROUPING OPTIONS
WHICH TYPES OF RADIUS CIRCLE AND COVERAGE MAPS ARE THERE?
Straight-Line Distance Radius Circles
Create simple radius circles based on straight-line distance from any location. Straight-line radius maps help you quickly visualize general geographic reach, nearby customers, operational coverage, and regional proximity.
These maps are ideal for high-level territory analysis, expansion planning, and customer accessibility workflows.
Drive Time Polygons
Visualize how far customers, drivers, field teams, or service vehicles can realistically travel within a specific amount of time. Drive time polygons account for real road networks and travel conditions instead of simple straight-line distance.
This helps you analyze operational reach more accurately and improve service coverage planning.
Drive Distance Polygons
Build coverage areas based on actual driving distance instead of direct geographic distance. Drive distance polygons help you understand how far teams or customers can travel using real roads and transportation routes.
This improves territory planning, routing workflows, and geographic operational analysis.
Pro Tip: Use drive time polygons instead of straight-line radius circles when analyzing real-world service coverage, dispatch planning, or customer accessibility.
Combine Radius Maps With Operational Data
Overlay radius circles, drive time polygons, and drive distance polygons alongside territories, customer density maps, demographic overlays, and operational metrics. Combining geographic layers helps uncover regional patterns and operational inefficiencies faster.
This creates a more complete view of geographic reach and operational performance.
Pro Tip: Combine radius circles with customer density maps and demographic overlays to quickly identify high-demand regions that fall outside your current operational reach.
TURNRADIUS ANALYSISINTO SMARTERDECISIONS
Improve Geographic Coverage and Planning
Identify Coverage Gaps More Quickly
Visualize where operational coverage ends and underserved regions begin using interactive radius maps. Radius analysis helps you uncover geographic blind spots, disconnected service areas, and regions that may need additional support.
This improves operational visibility and helps optimize regional planning strategies.
Reduce Drive Time and Overlap
Compare overlapping service areas, territories, and operational regions to identify inefficient geographic coverage. Radius circles help you better distribute teams, reduce windshield time, and streamline operational workflows.
This supports more efficient territory structures and regional operations.
Improve Territory and Site Planning
Use radius analysis to evaluate how locations, territories, and facilities interact geographically before making operational decisions. Radius maps help you better understand proximity, accessibility, and market reach visually.
This improves strategic planning while reducing geographic uncertainty.
Strengthen Geographic Reporting Workflows
Use radius maps in dashboards, reports, and presentations to communicate geographic reach more clearly across teams. Visual radius analysis helps simplify complex operational data and makes geographic trends easier to understand.
This improves collaboration and supports faster decision-making organization-wide.
Combine Radius Maps With Live Data
Overlay radius circles alongside customer locations, operational metrics, routes, territories, and demographic data from a single interactive workspace. Centralizing geographic analysis helps teams uncover operational patterns much faster than spreadsheets alone.
This creates a more complete view of regional performance and operational reach.
Pro Tip: Overlay radius circles with territories, heat maps, and customer density layers to quickly identify profitable expansion regions and optimize service coverage.
CREATE A MAP THAT MOVES WITH YOU
WHATMAKES MAPLINE SODIFFERENT
SIMPLEST MAPPING SOLUTION
Plot multiple locations from Excel in seconds.
No coding, no setup—just copy, paste, and go.
Mapline makes it effortless to build custom maps with pins that transform your spreadsheets into visual insights you can act on immediately. Plot multiple locations from Excel in seconds.
No coding, no setup—just copy, paste, and go.
Mapline makes it effortless to build custom maps with pins that transform your spreadsheets into visual insights you can act on immediately.
POWERFUL MAP-BASED ANALYTICS
Mapline isn’t just a map tool— it’s a full-suite analytics platform.
Create a map, layer on territories, analyze performance, and automate workflows that help your business move faster.
Every map you create becomes a data-powered decision engine. Mapline isn’t just a map tool— it’s a full-suite analytics platform.
Create a map, layer on territories, analyze performance, and automate workflows that help your business move faster.
Every map you create becomes a data-powered decision engine.
Don’t just take our word for it:
“If you’re an advertiser, you want to know the markets I’m in. So, what am I going to do? Print out a spreadsheet? No, of course not. I’m going to use Mapline.”
– Sam Anthony, Your News
“I’m able to get a very complex, very deep and profound analysis.”
– Juan Hernández, RE/MAX
“Thank you Mapline for such an AMAZING program that is saving us money and building confidence in our future growth!”
– Lydia Rogers, Greenworks Commercial
“When people see it, they believe it. I show potential affiliates the map to start, just to show them how many markets we’re in and how we’re expanding.”
A radius circle map visualizes geographic coverage around a specific location using customizable distance-based circles. Radius maps help you analyze service areas, customer proximity, operational reach, and regional accessibility more clearly.
Select a location, define your radius distance, and instantly generate interactive coverage circles around any point on the map. Radius maps can be layered with territories, customer data, routes, and demographic overlays.
Radius maps help you visualize geographic reach, identify underserved markets, improve territory planning, optimize service coverage, and analyze customer proximity more effectively.
Yes. Mapline allows you to generate multiple radius circles simultaneously to compare locations, territories, service areas, operational hubs, and market reach.
Radius analysis helps you uncover geographic gaps, overlapping territories, disconnected service areas, and operational inefficiencies visually on interactive maps.
Yes. Radius maps help evaluate how far locations can realistically serve surrounding customers and regions before expanding operations or opening new facilities.