with Geospatial Insights
- Blog
- Geo Mapping
- GIS Spatial Data Analysis: Unlock Smarter Decisions with Geospatial Insights
GIS spatial data analysis has transformed the way organizations understand and act on their data. Instead of relying on charts and spreadsheets alone, teams now visualize data through a geographic lens—uncovering patterns, trends, and opportunities that would otherwise remain hidden. From retail site planning to public health response, spatial analysis delivers the context needed to make better decisions, faster.
At its best, GIS spatial data analysis doesn’t just show where something is—it tells you what to do next. And with modern, user-friendly platforms like Mapline, you don’t need a degree in GIS to unlock those insights. You just need the right tools to turn location-based data into real-world results.
What Is GIS Spatial Data Analysis?
GIS spatial data analysis is the process of examining geographic or location-based data to identify patterns, trends, and relationships that influence decision-making. It goes beyond simple mapping—applying analytical techniques to understand how data points relate to one another across space and time.
In practice, this means layering customer data, service areas, infrastructure, or external variables (like weather or population density) onto a map—then running analysis to determine:
- Where are the highest-performing regions?
- What geographic gaps or overlaps exist in coverage?
- How can we optimize based on proximity or clustering?
With the right GIS software, spatial analysis becomes an intuitive part of your everyday workflow. Mapline’s no-code platform allows you to run these analyses without scripting or complex toolsets—bridging the gap between data science and business strategy.
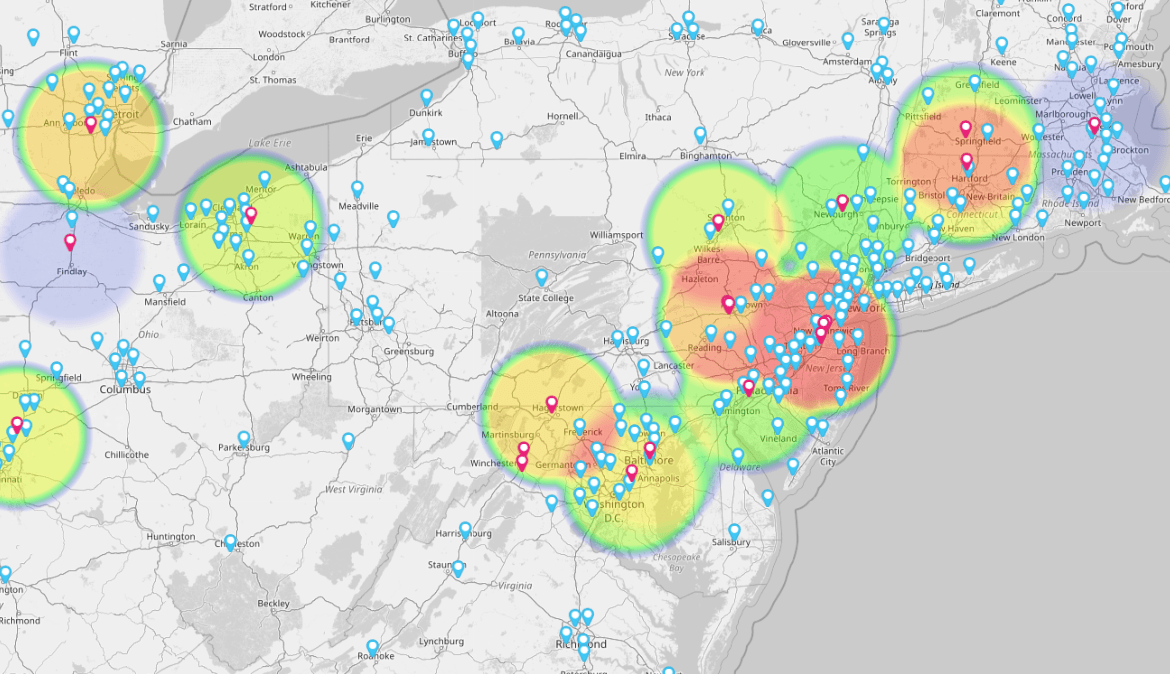

Pro Tip: Don’t just map your data—layer it. Combining multiple spatial datasets (like customer locations, demographics, and competitor zones) reveals patterns you can’t see in isolation. Use Mapline’s map layering tools to compare datasets visually, identify high-opportunity zones, and make smarter, more strategic decisions faster.
How Spatial Analytics Drives Business Results
At its core, spatial analytics reveals the “where” behind your business data. This geographic context gives you a strategic edge—helping you understand performance patterns, predict outcomes, and allocate resources more effectively.
Some of the most common geospatial data analytics benefits include:
- Customer segmentation by location: Discover buying patterns, regional preferences, or underserved zones.
- Territory optimization: Balance sales or service regions based on workload, coverage, or proximity.
- Market forecasting: Predict demand using location-based trends and historical patterns.
- Operational efficiency: Streamline routes, reduce delivery costs, or optimize site visits.
Mapline makes it easy to layer, compare, and analyze geographic data—all within a single platform. Whether you’re a data analyst or an operations manager, you can extract actionable insights from your maps in minutes.
Real-World GIS Analysis Examples
GIS spatial analysis is used across industries—from global enterprises to small teams. Logistics companies use it to optimize delivery routes and reduce fuel costs by identifying the most efficient paths. Retailers rely on spatial data to choose new store locations based on customer density, competitor proximity, and demographic trends. Public health organizations map outbreaks and deploy resources more effectively using location-based insights. Utility companies plan infrastructure upgrades by analyzing service coverage and environmental risks. No matter the field, spatial data turns location into a strategic advantage.
Retail Site Selection
Retailers use geoanalytics to evaluate new store locations based on population density, competitor presence, and purchasing behavior. Spatial analysis helps identify the most profitable areas while avoiding cannibalization of nearby stores.
Logistics Route Optimization
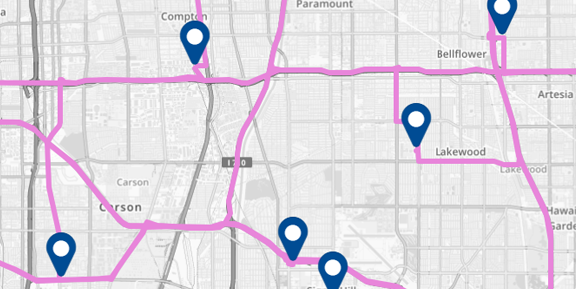
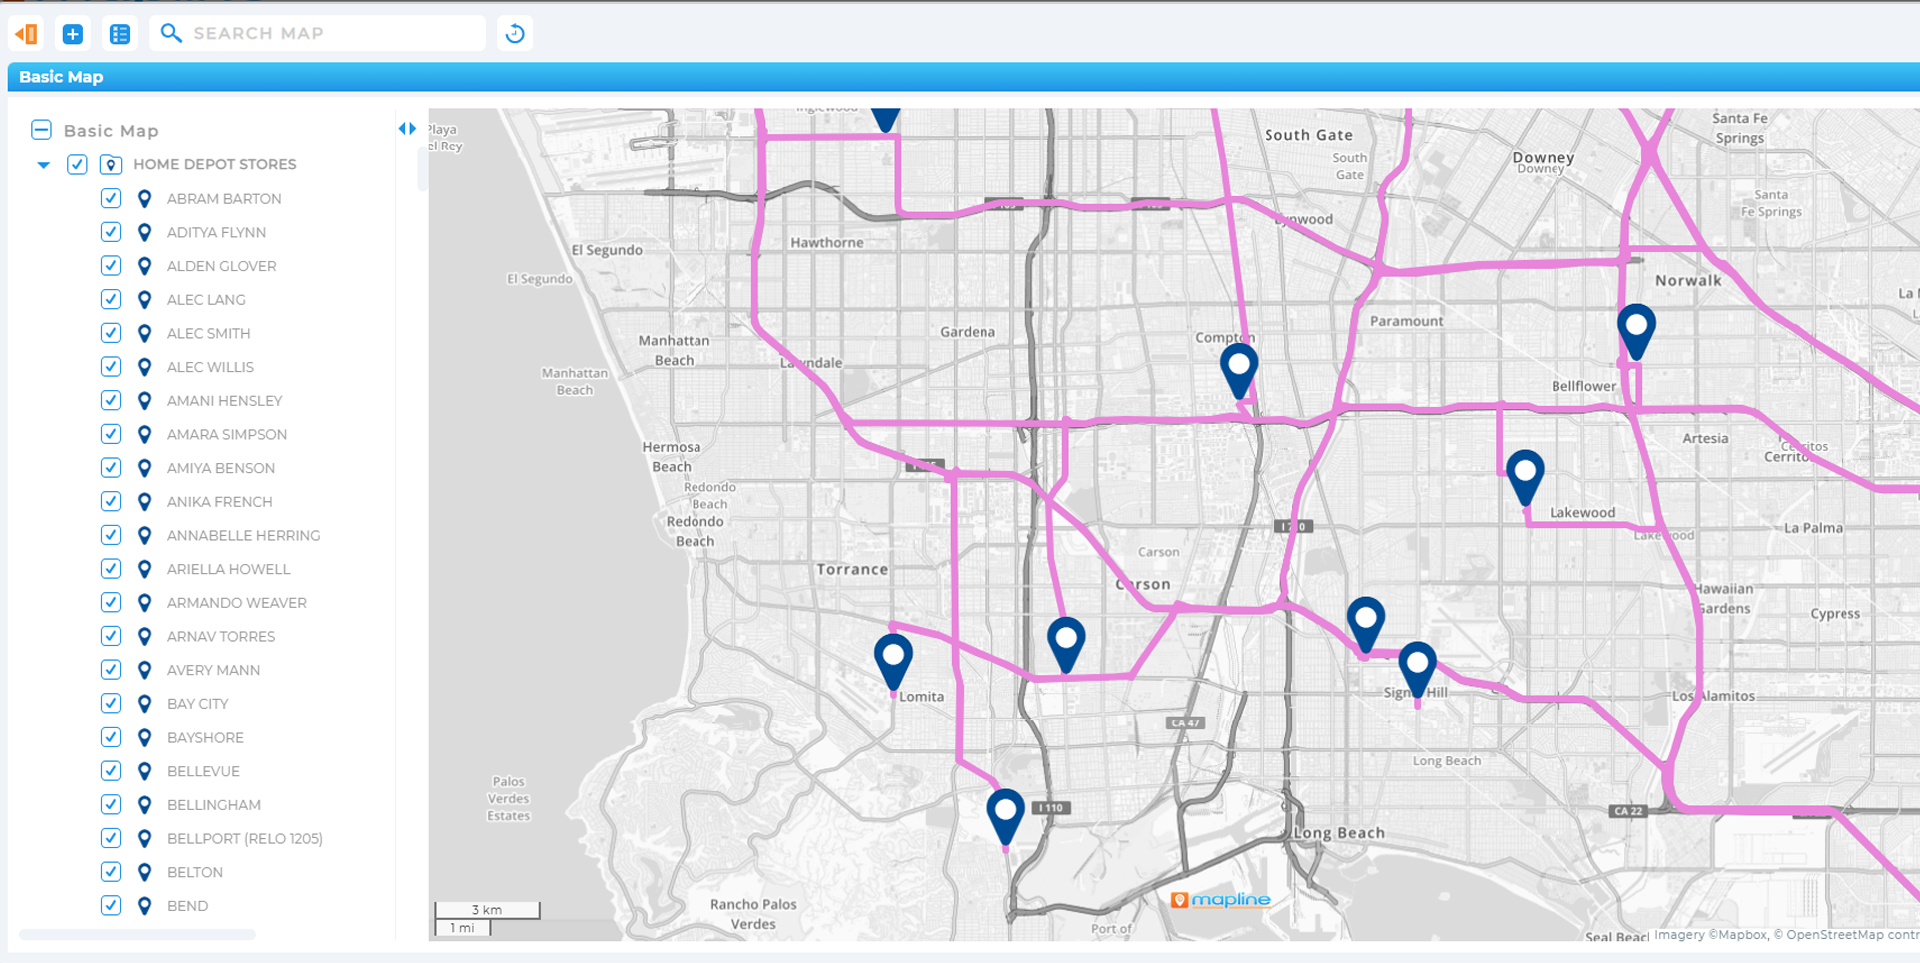
Delivery and field service teams use GIS spatial analysis to streamline routes, reduce fuel costs, and ensure timely service. By visualizing route overlap or time windows, companies improve both efficiency and customer satisfaction.
Public Health & Risk Zones
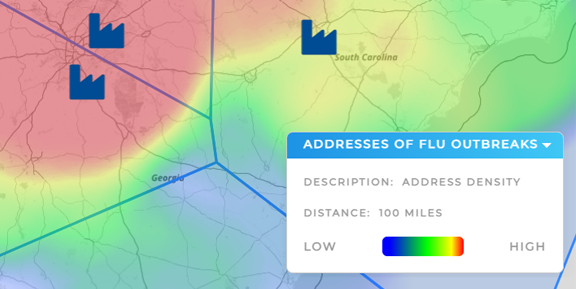
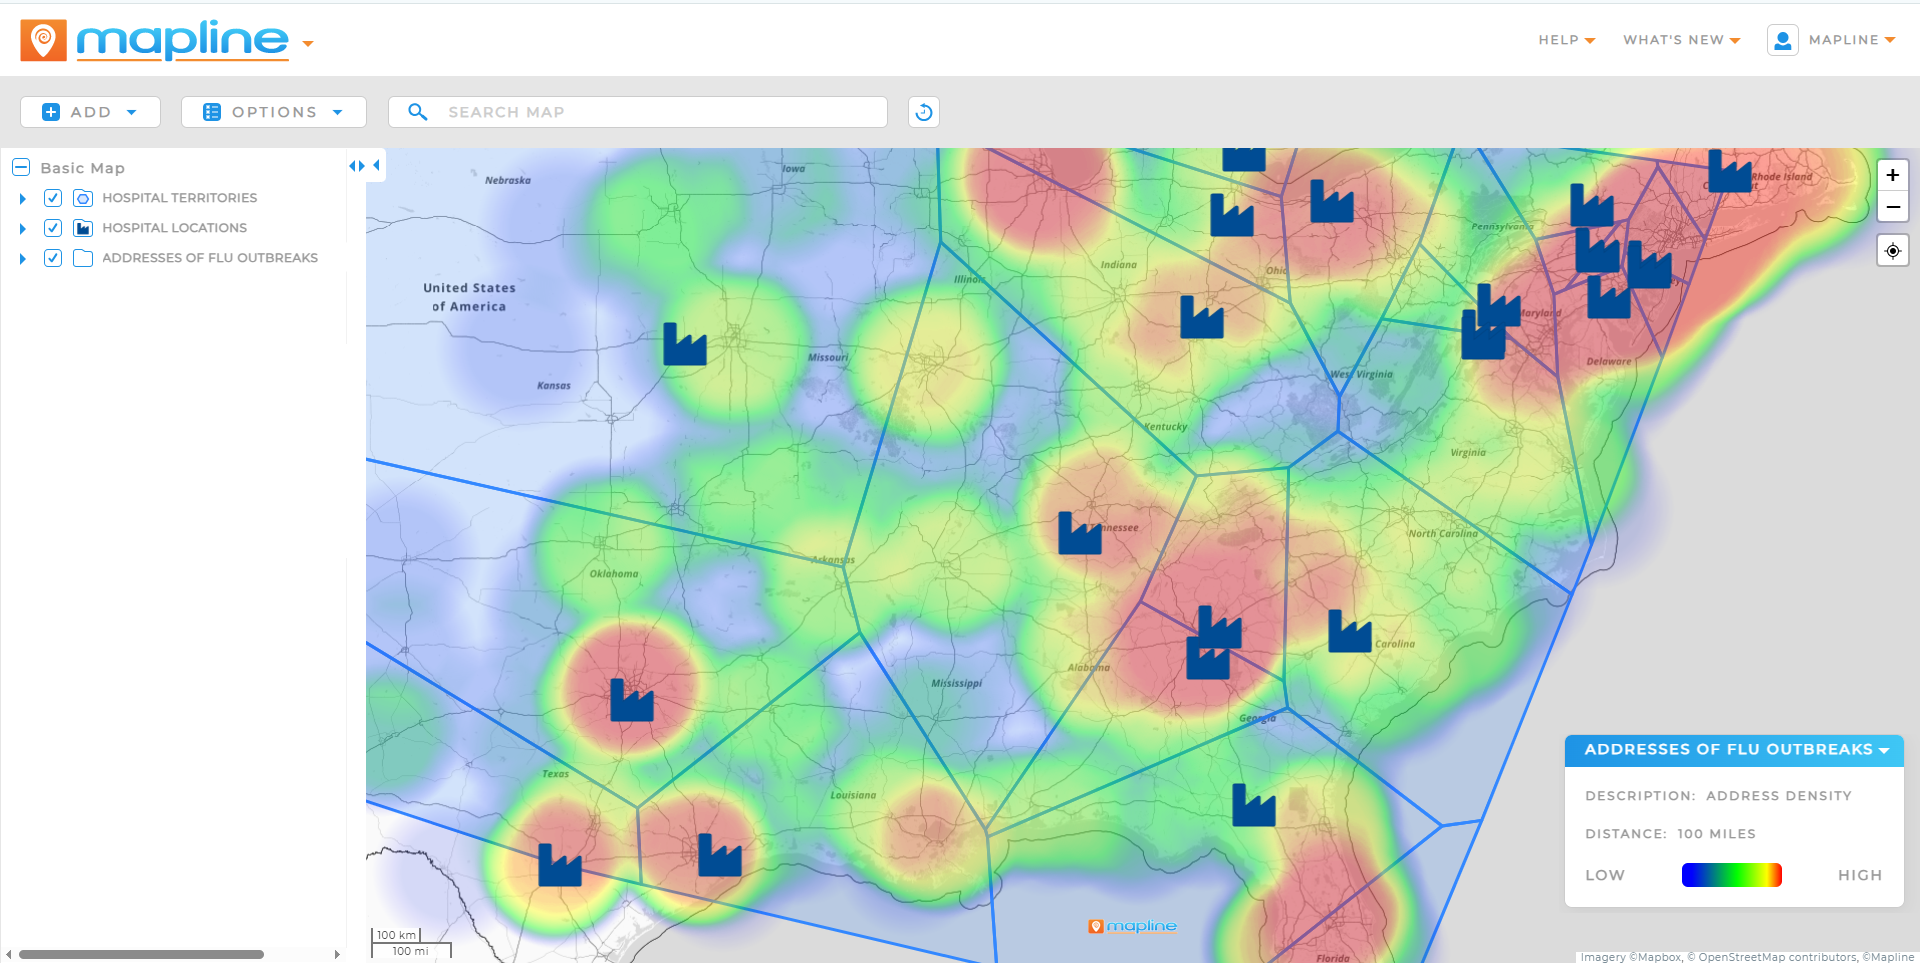
Public agencies map health incidents to identify outbreak clusters, high-risk zones, or underserved populations. By overlaying location data with demographics, they can better allocate resources and track intervention outcomes.
Urban Planning & Infrastructure
City planners use geographic data analysis to plan roads, utilities, and zoning changes. Spatial tools allow them to simulate impact, model future growth, and design cities with accessibility and sustainability in mind.
Each of these use cases combines GIS tools with real-world business or policy goals—proving that spatial data analysis is as practical as it is powerful.
Geospatial Analysis Techniques and Tools
Modern GIS platforms offer a wide range of tools for spatial analysis—some complex, others intuitive. Mapline focuses on simplifying the most useful techniques for everyday users, making spatial analysis accessible to more teams without sacrificing depth.
Here are some of the most common geospatial analysis techniques:
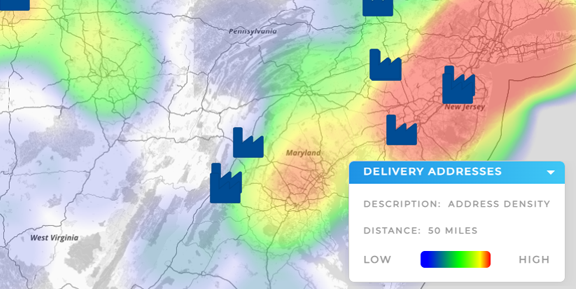
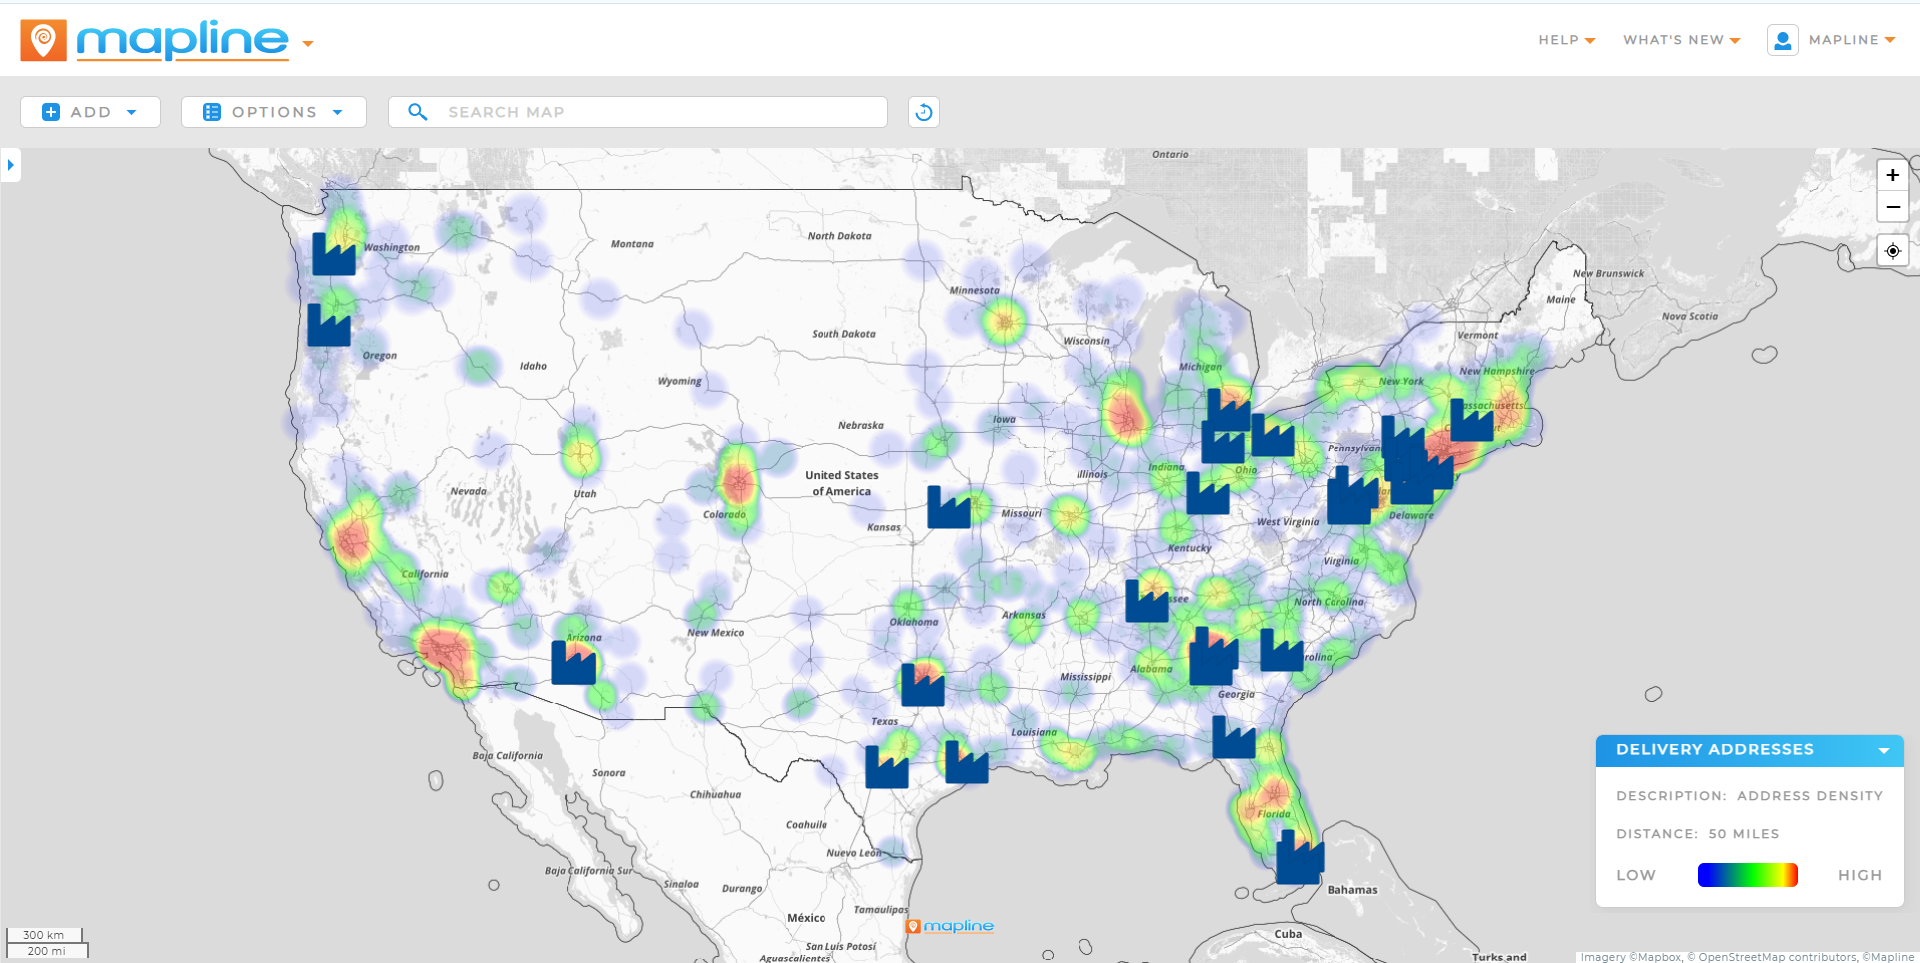
- Heat Maps: Show intensity of activity across a region (e.g., sales density, service volume).
- Clustering: Group data points based on proximity to identify patterns or opportunities.
- Radius and Buffer Zones: Define impact areas around a store, delivery hub, or asset.
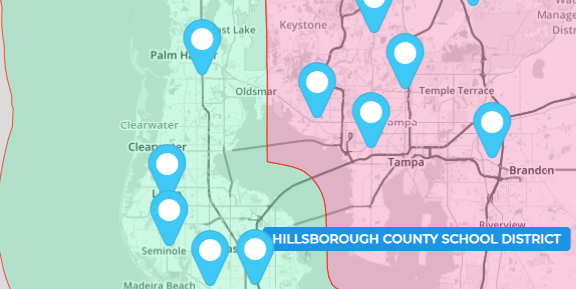
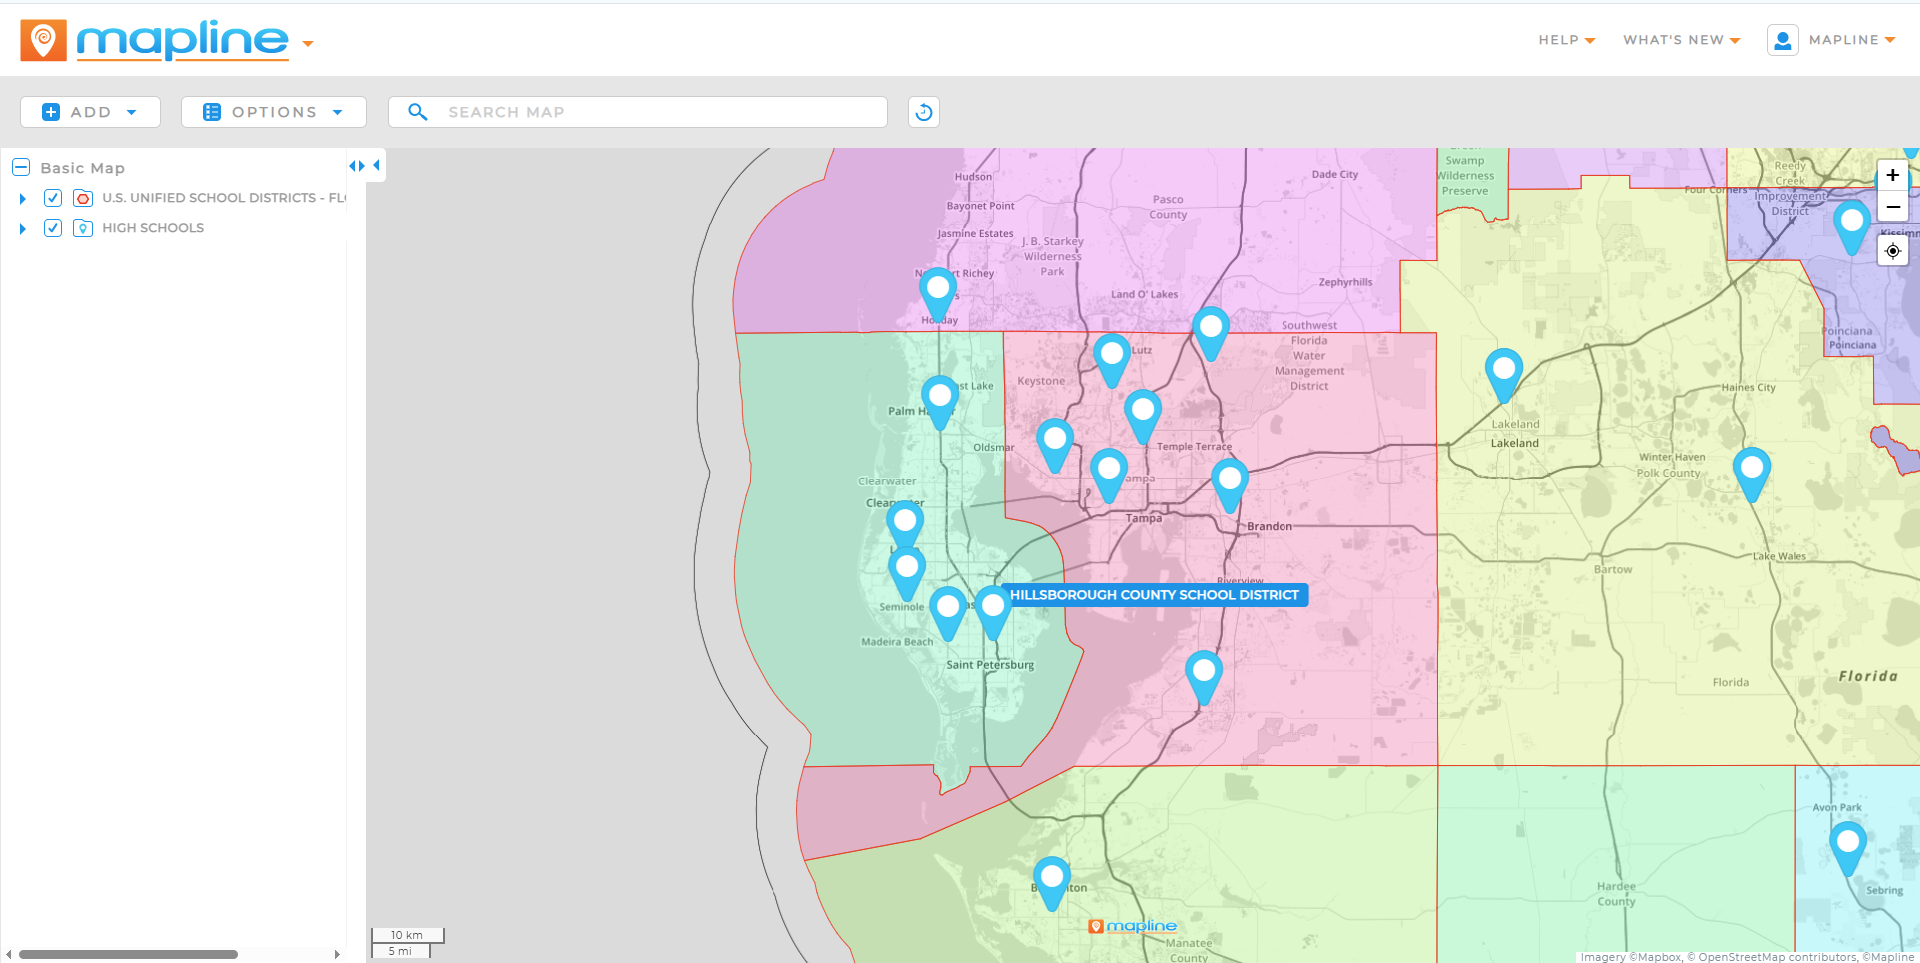
- Overlay Analysis: Combine multiple layers (e.g., income, population, competitor locations) to reveal correlations.
- Distance Calculations: Measure distances between points to prioritize assignments or manage logistics.
With Mapline, these tools are built into a visual interface—no GIS experience required. Unlike legacy systems that require scripting or third-party plugins, Mapline lets you generate meaningful analysis in just a few clicks.
Why Mapline Is Built for Spatial Intelligence
Mapline isn’t just another GIS tool—it’s a complete geospatial intelligence platform designed for speed, clarity, and usability. While traditional platforms require advanced training or IT support, Mapline is built for business users who need answers now.
Here’s how Mapline helps you go further with GIS spatial data analysis:
- No-Code Interface: Run complex spatial analyses without writing a line of code.
- Interactive Dashboards: Combine maps, charts, and KPIs into live dashboards filtered by geography.
- Territory Intelligence: Build and rebalance territories based on real-time performance and capacity.
- Auto Optimization: Reassign locations, shift schedules, or redistribute work in minutes.
- Multi-Layer Mapping: Overlay internal and external datasets for deeper insight.
- Fast Onboarding: Be up and running in days—not weeks—with templates and expert support.
With Mapline, GIS data analytics is no longer confined to specialists. It becomes part of your everyday business intelligence toolkit.
LEVERAGE GIS SPATIAL DATA ANALYSIS NOW
GIS spatial data analysis is no longer reserved for technical teams or massive datasets. With tools like Mapline, it’s easier than ever to visualize your data, extract insights, and act with confidence. Whether you’re optimizing territories, planning a new location, or tracking performance across regions, spatial analytics gives you the edge.
If your team is still stuck in spreadsheets or static dashboards, it’s time to add location to the equation. Mapline turns geo data into real-time, actionable intelligence—so you can move faster, smarter, and with total clarity.
The terms are often used interchangeably. Spatial analysis focuses on relationships between data points based on location, while geospatial analysis typically includes geographic coordinates and mapping tools.
Yes—data science and spatial analytics often overlap. GIS platforms like Mapline allow data scientists and analysts to add geographic context to large datasets, improving predictions and insight quality.
GIS supports business analytics by showing how performance, demand, or resources vary across geographic regions. This helps companies make better decisions about growth, logistics, and service strategies.
Mapline offers one of the most intuitive and powerful GIS platforms available today, combining map-based intelligence, automation, and dashboards. Other tools include ArcGIS and QGIS, though they require more training and setup.
Absolutely. Platforms like Mapline are designed specifically for business users and field teams who need quick, clear answers from their data—no GIS degree required.


