- Blog
- Geo Mapping
- Heat Map Generator Strategies for Real Estate Investment Firms
In the competitive world of real estate, investors are constantly searching for an edge—something that helps them move faster, choose smarter, and outperform market trends. A powerful heat map generator can provide exactly that. With the right mapping software, real estate firms can transform raw data into visual, location-driven insights that reveal the smartest investment opportunities. Whether you’re working with rental portfolios, flipping residential properties, or scaling commercial developments, heat maps bring clarity to geographic decisions. Let’s explore how modern real estate firms are using heat map generators to drive growth and boost ROI.
Why Real Estate Investment Demands Geographic Intelligence
Location has always been a cornerstone of real estate strategy, but today’s investors need far more than a hunch or a good zip code. Geographic insights powered by real estate heat mapping software help firms evaluate dozens of data layers—property values, population trends, nearby developments, rental demand, and more—all in one view. By converting spreadsheets into interactive visualizations, investors can uncover patterns, correlations, and blind spots they might otherwise miss.
This level of analysis gives firms a competitive advantage. It supports confident site selection, highlights neighborhood growth potential, and prevents wasted investments in oversaturated markets. In short, real estate firms use heat map tools to bring precision, speed, and strategy to their investment decisions.


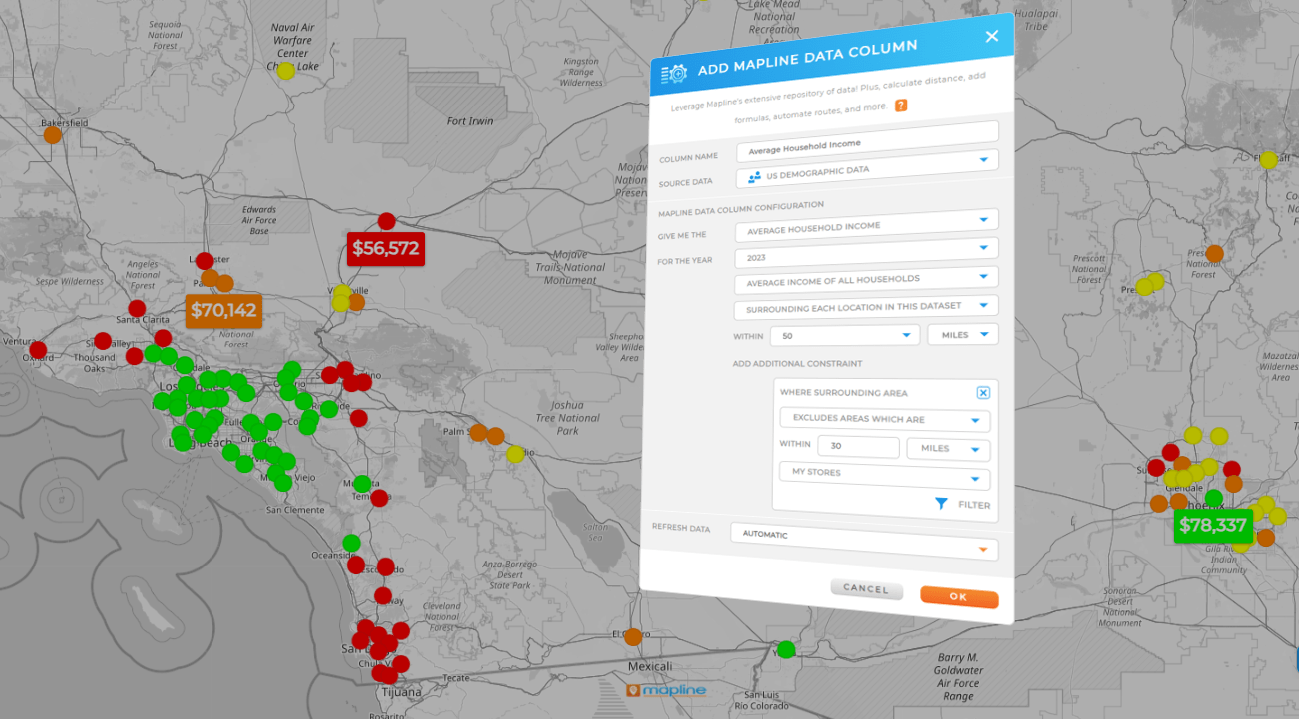
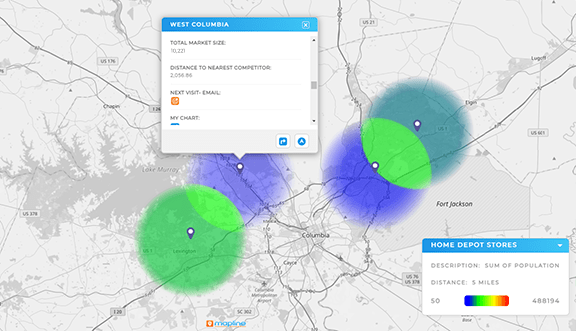
Pro Tip: Use Mapline’s Geo Mapping platform to layer multiple data points in a single map—so you can track property values, analyze market saturation, and plan your next investment all in one place.
How Real Estate Investors Use Heat Map Generators Strategically
In real estate, geography is everything—and heat maps are one of the fastest ways to evaluate location-driven decisions at scale. Whether you’re analyzing property value trends, identifying prime investment zones, or comparing neighborhood saturation, a heat map generator reveals key insights that drive smart, data-backed strategies. Mapline helps real estate firms transform spreadsheets of listings, market stats, or demographic data into visual tools that tell a story. This empowers investors to pinpoint high-opportunity areas, avoid overdeveloped regions, and make confident moves faster than the competition. Below are just a few ways leading investment firms use heat maps to stay ahead of the market.
Spot Property Value Trends by Neighborhood
Mapline’s heat mapping tools allow you to visualize property values across zip codes, counties, or custom boundaries. This makes it easy to track appreciation rates and compare neighborhood growth patterns over time. Investors use this insight to find undervalued pockets and predict emerging hot zones. With customizable data layers, you can highlight year-over-year changes, identify pricing outliers, or compare similar neighborhoods side-by-side—all without needing GIS training or technical skills.

Identify Underserved or High-Potential Zones
By layering heat maps with demographic or economic data, investors can find areas with rising demand but limited competition. These “opportunity zones” often represent ideal targets for new development or rental property acquisition. For example, Mapline allows firms to overlay income data, housing availability, population growth, and competitor locations to pinpoint where unmet demand is highest. Investors use this data to strike early, establish market presence, and avoid bidding wars.

Visualize Market Saturation for Smarter Positioning
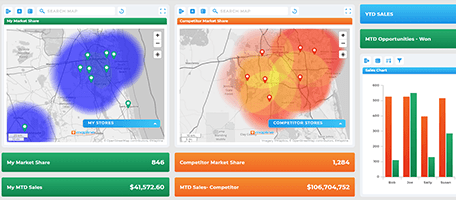
Use heat maps to track competitor density and property concentration within specific geographic areas. This helps firms avoid oversaturated neighborhoods and reposition investment dollars toward less crowded, higher-margin regions. Mapline enables side-by-side comparisons across cities or zip codes, offering clear insights into where your brand will stand out—and where the competition might be too dense to thrive. This visual approach supports smarter, long-term planning.

Compare Location Metrics Across Portfolios
Investors managing multiple markets or asset types rely on visual comparisons to prioritize where to scale. With Mapline, you can map your current portfolio alongside target areas and performance metrics, helping you visualize performance gaps and diversification opportunities. Whether you’re balancing risk across regions or assessing rental yield per location, heat maps turn complex portfolio analysis into a clear geographic story.

Beyond Visualization: Heat Maps for Strategic Action
Real estate heat maps aren’t just for analyzing past performance—they’re also tools for planning what’s next. Strategic firms use heat maps to support expansion into new territories, optimize existing assets, and respond quickly to market shifts. Here are some ways Mapline supports proactive decision-making:
- Track neighborhood investment trends to identify where other investors are active and spot high-momentum markets.
- Combine geographic and time-based data to analyze seasonality, property turnover, or renovation timelines.
- Create market saturation maps that visualize the number of similar property types in specific regions.
- Overlay public data sources like school ratings, transit routes, or crime reports to evaluate livability and desirability.
Armed with this level of insight, real estate teams can work faster, justify decisions with data, and demonstrate clear ROI to stakeholders or investors.
What Sets Mapline Apart for Real Estate Use Cases
While there are many heat mapping tools available, Mapline offers features uniquely suited to the real estate industry. Its no-code interface makes it fast and easy to build maps from your own data—no training required. You can upload an Excel spreadsheet and create a real estate investment map in under 60 seconds. Then, customize the visual output based on location, property type, value, or performance metrics.
Here are just a few Mapline features that real estate firms love:
- Territory Creation: Draw custom zones or use predefined postal codes to organize regions by agent, broker, or office coverage.
- Data-Driven Heat Maps: Visualize numeric data like rent prices, closing times, or occupancy rates with adjustable color gradients.
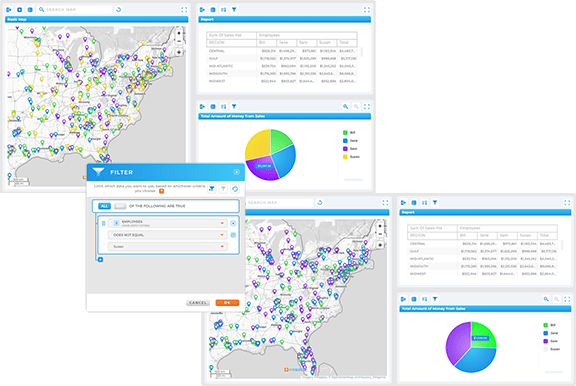
- Interactive Dashboards: Share live map views and dashboards with internal teams or investors to track key KPIs.
- Custom Pin Bubbles: Clickable location markers can show address details, investment stage, notes, or valuation data.
How Real Estate Firms Are Seeing Results
Data visualization is more than just a pretty map—it’s a driver of real results. Investors using Mapline’s heat mapping software report higher confidence in their location decisions, faster turnaround on analysis, and better returns from the properties they choose.
One client, for example, used Mapline’s real estate data visualization tools to identify overlooked zip codes with high rental yield potential. Another layered economic development zones over existing listings to find tax-advantaged investment areas that competitors had missed. These firms didn’t just gain clarity—they gained a market advantage.
Start Turning Your Location Data Into Strategy
If you’re still trying to evaluate properties using spreadsheets and instinct, it’s time to upgrade. A heat map generator gives real estate investors the speed and clarity needed to move ahead of the market, identify the right opportunities, and avoid costly mistakes. With Mapline, you don’t need a GIS expert or a long onboarding process—you just need your data and a browser.
From property value heat maps to neighborhood investment trends, Mapline transforms location data into a visual decision-making engine. Get started today and discover how better mapping leads to smarter investing.


