- Blog
- Geo Mapping
- Using a Heat Map Generator to Uncover Sales Opportunities
If you want to stay competitive in today’s market, you need more than spreadsheets and sales reports—you need real-time insights that help you act faster, plan smarter, and close more deals. Enter the heat map generator, one of the most powerful tools in modern sales analytics. By visualizing data like customer locations, sales volume, and market performance across regions, heat maps turn raw numbers into clear, actionable insight.
In this guide, we’ll explore how heat maps help uncover new opportunities, drive smarter sales strategies, and accelerate business growth.
What Is a Heat Map Generator?
A heat map generator is a software tool that converts raw data into a color-coded map, highlighting areas of high and low activity. The intensity of color represents data density, such as high sales volume, customer concentration, or service calls in a region. These visualizations make it easy to identify trends that are hard to spot in rows of numbers.
Whether you’re analyzing sales by zip code or plotting regional trends across territories, heat mapping software can bring new clarity to your strategy. Tools like Mapline’s heat map generator let you upload an Excel spreadsheet, choose the data column you want to analyze, and instantly generate an interactive map.

Pro Tip: Ready to turn your sales data into clear, actionable insights? Try Mapline’s powerful Geo Mapping tools to build your first sales heat map today—no coding required.
Why Heat Maps Are a Game-Changer for Sales Teams
Traditional reports show you what’s happening—heat maps show you where. For field reps, regional managers, and executives alike, geographic visualizations offer powerful advantages:
- Fast pattern recognition: Spot high-performing areas and underserved markets at a glance
- Data-backed decisions: Build your sales strategy around real-world trends
- Increased efficiency: Allocate resources and reps to the areas with the highest impact
- Improved team alignment: Share visual insights that are easy for anyone to understand
Sales heat maps don’t just show you where your customers are—they reveal what actions you should take next.
Sales Territory Visualization That Works
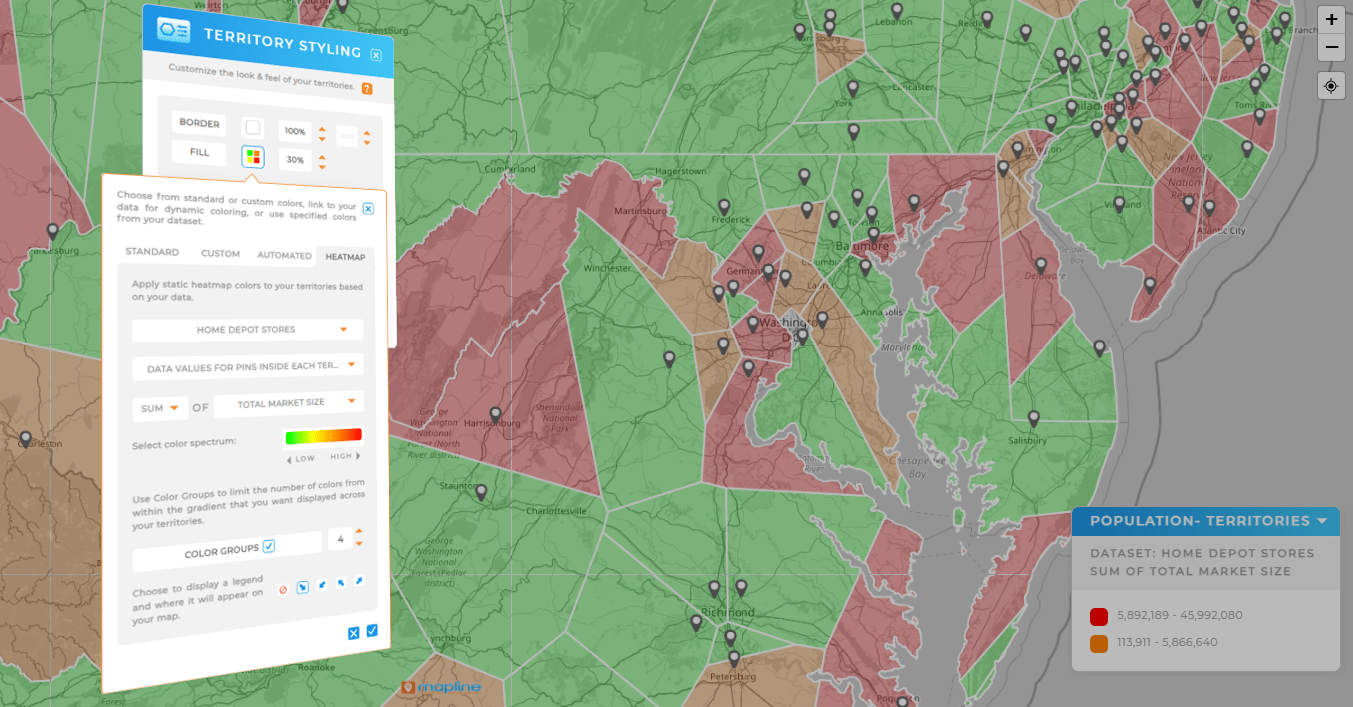
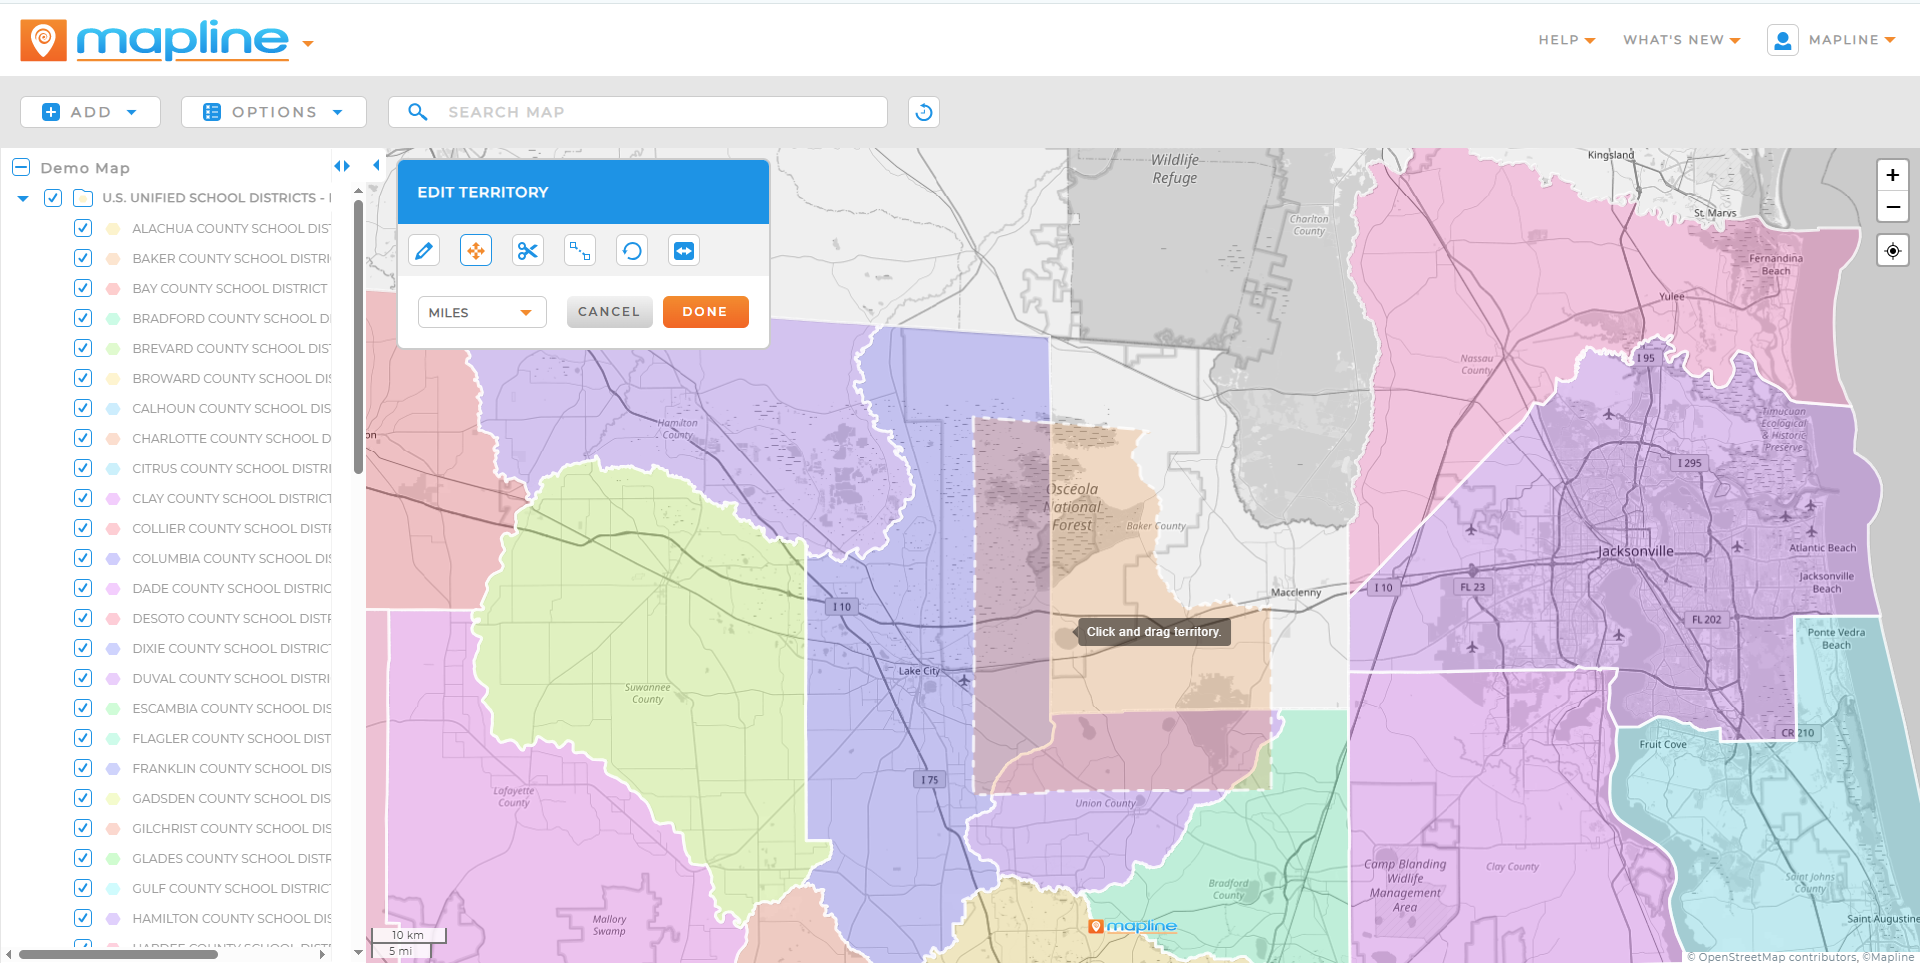
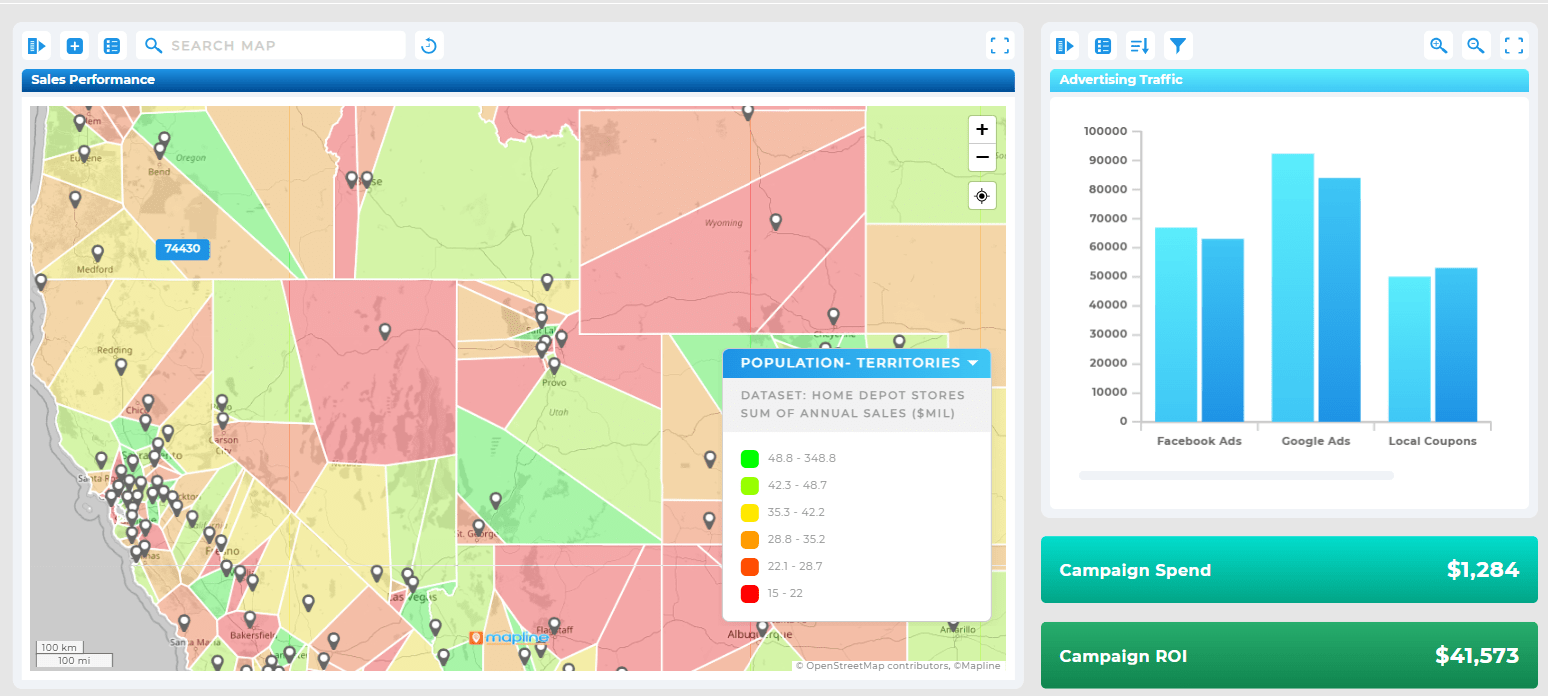
One of the most effective uses of a heat map generator is visualizing sales territories. By assigning color-coded areas based on rep assignments or sales volume, you can instantly see how well your territories are balanced. Are some reps overloaded while others are underutilized? Is there a dense cluster of leads in one area that isn’t getting attention?
Mapping your territories visually helps answer these questions with confidence. You can even overlay other data layers—like population demographics or competitor locations—to fine-tune coverage and improve sales performance mapping.
Identifying Customer Hot Spots
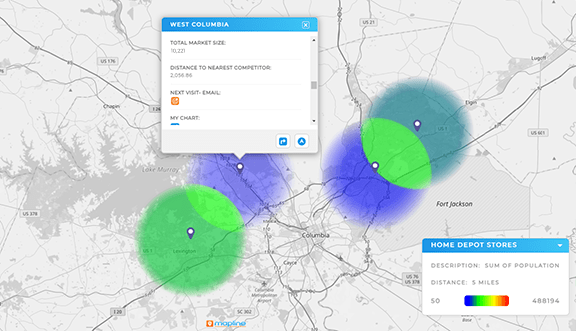
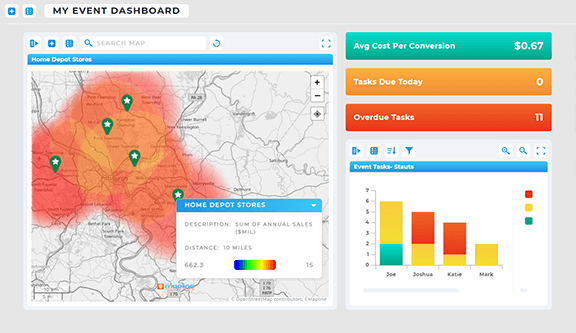
Another critical application of heat mapping is identifying customer density hot spots. If you have thousands of customers spread across a region, it’s difficult to see meaningful clusters in a table. With a heat map, however, hot zones light up immediately, showing where demand is highest.
Use this data to:
- Launch targeted promotions in high-demand areas
- Identify ideal zones for new storefronts or reps
- Tailor product offerings to local demand
This is especially useful in industries like retail, logistics, and field services, where location-driven demand plays a major role in success.
Uncover Regional Sales Trends Over Time
Heat maps aren’t just for static snapshots—they’re also great for comparing sales performance over time. With the right mapping and analytics software, you can compare last quarter’s results to this quarter’s, spot upward or downward trends, and refine your strategy before problems grow.
Here’s how it works:
- Create a map showing regional sales for a given time period
- Layer a second map using updated data
- Compare side-by-side to reveal shifts in performance
This approach supports data-driven decision making and helps regional managers anticipate changes in the market—before they affect the bottom line.
Heat Map Generator and Geographic Sales Analysis in Action
Let’s walk through a few real-world use cases where companies used heat map generators to improve sales outcomes:
1. Franchise Expansion Strategy
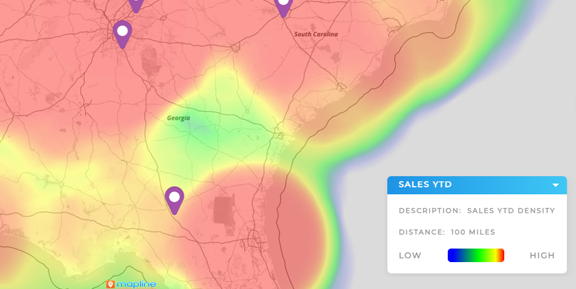
A franchise chain used Mapline’s heat maps to identify areas with high customer demand but no nearby locations. By analyzing sales hot spots alongside competitor data and demographics, they prioritized new markets for expansion—and saw a 15% increase in quarterly sales after launching new stores in those zones.
2. Field Team Optimization
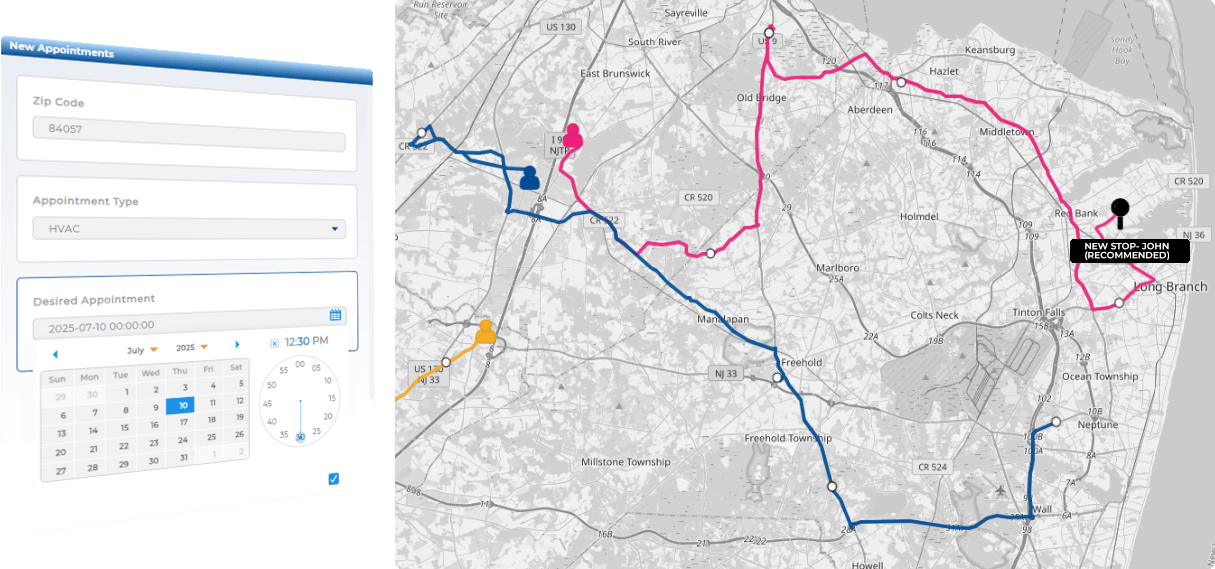
A regional sales team used heat mapping software for sales to balance rep workloads across five territories. After visualizing rep performance by zip code, they redrew boundaries to improve efficiency and assigned new leads more strategically. The result? A 12% bump in average close rate.
3. Product-Specific Marketing Campaigns
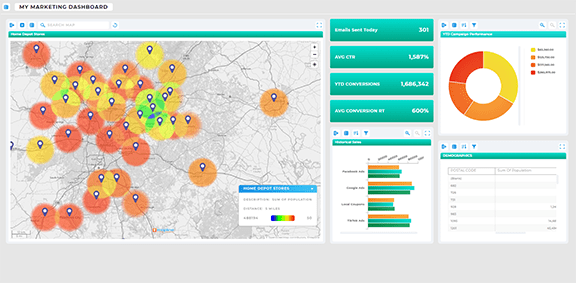
A consumer electronics brand noticed one product line underperforming in certain areas. They used geographic sales analysis to build a heat map comparing product sales across regions. The findings helped them refocus marketing campaigns on high-opportunity zip codes, leading to a 20% sales lift in targeted areas.
Heat Map Generator and The Power of Location-Based Sales Insights
What makes heat maps so effective is their ability to deliver location-based sales insights at a glance. Instead of digging through thousands of rows in Excel, your team gets a top-down view of what’s happening, where—and why it matters.
Sales managers can spot trends. Reps can plan smarter routes. Executives can make data-backed investment decisions. Everyone benefits from having the same shared view of performance and opportunity.
How to Generate Your First Heat Map
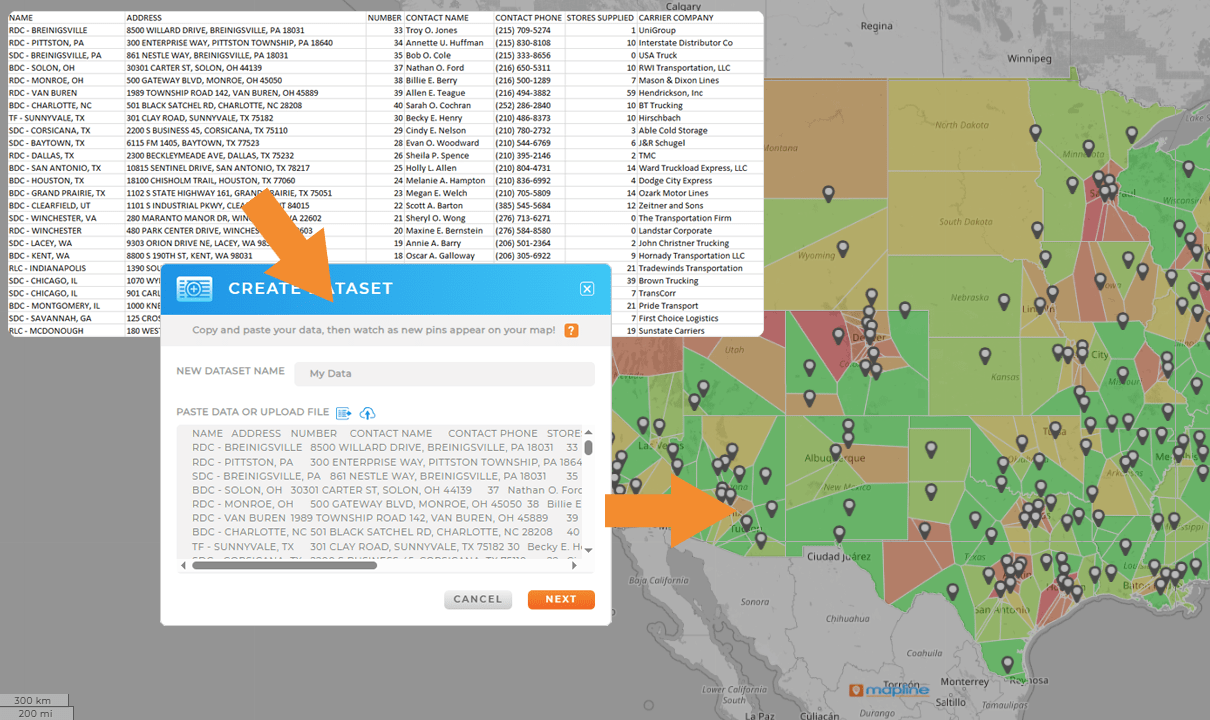
Not sure where to start? It’s easier than you think. With Mapline’s heat map generator, you can visualize your sales data in just a few steps:
- Upload your Excel or CSV spreadsheet
- Select the data column to base your heat map on (e.g., sales volume)
- Choose how you want to visualize the data—by area (shaded heat map) or pin density (bubble map)
- Customize the colors, filters, and map layers to tell your story
Once your map is live, you can explore insights interactively or export views to share with your team.
Choosing the Right Heat Map Generator for Sales
Not all heat map tools are created equal. When choosing a solution for your sales team, look for features like:
- Territory management: Easily assign, balance, and visualize sales rep regions
- Real-time data updates: Sync with your CRM or sales system for the latest insights
- Custom filtering: Drill down by product, rep, region, or timeframe
- Sharing and collaboration: Share maps securely with stakeholders and team leads
Choosing a platform like Mapline gives you these features—and more—designed specifically for business use cases.
Tips for Getting the Most Out of Sales Heat Maps
Want to unlock the full power of your heat maps? Keep these best practices in mind:
- Combine layers: Overlay competitor locations, demographics, and service areas to see a fuller picture
- Update regularly: Heat maps are most valuable when based on fresh data
- Use filters wisely: Isolate variables to pinpoint exactly what’s driving results
- Tailor by audience: Build different views for executives, sales reps, or regional managers
Remember—visualization is only the first step. The real value comes from the decisions you make using the insights your maps reveal.
Yes. Whether you have five techs or five hundred, Mapline’s tools scale with your team and support custom workflows.
Maps reveal spatial patterns, overlap, and trends that are invisible in spreadsheets—helping you act faster and with more context.
Yes. Mapline is built for business users—no coding, no GIS training required. Just upload, map, and go.
Yes. You can import data from spreadsheets, CRMs, or other systems to keep your maps aligned with your existing workflows.
By visualizing shared data in an intuitive map format, Mapline ensures that executives, managers, and field teams are all operating from the same playbook—reducing silos and boosting executional alignment.


