- Blog
- Geo Mapping
- How to Export Map Images for Presentations Without Losing Resolution
When you add a map to a presentation, clarity matters. Blurry screenshots make your work look unprofessional and hide the insights you’re trying to show. Instead of zooming in, cropping, or screenshotting your map, exporting directly from mapping software lets you download a polished, high-resolution image designed for slides, PDFs, reports, and executive presentations. The result? Crisp visuals that make your insights stand out—and help your audience understand exactly what they’re looking at.
In this guide, you’ll learn how to export map images without losing resolution, and how Mapline makes the process effortless, whether you’re presenting a world map, regional boundary map, or location pins for a specific territory.
Why High-Resolution Map Exports Matter
When your audience can clearly see shapes, territories, data points, and pin details, your insights land faster. High-resolution map exports eliminate pixelation and preserve styling, helping you present clear visual data without distracting distortions. This matters especially for teams that show maps in PowerPoint, PDF reports, or printed boardroom decks. A high-quality export ensures your work looks polished in every format, from screens to printouts. Exporting your map also saves time, eliminating the need to rebuild visuals in Photoshop or other design tools.

Pro Tip: Instead of exporting multiple map versions and manually creating slides, build all your visuals in a single map and export slide-ready images at different zoom levels. Mapline keeps everything consistent — colors, shapes, labels, and formatting.
How to Export a High-Resolution Map Image in Mapline
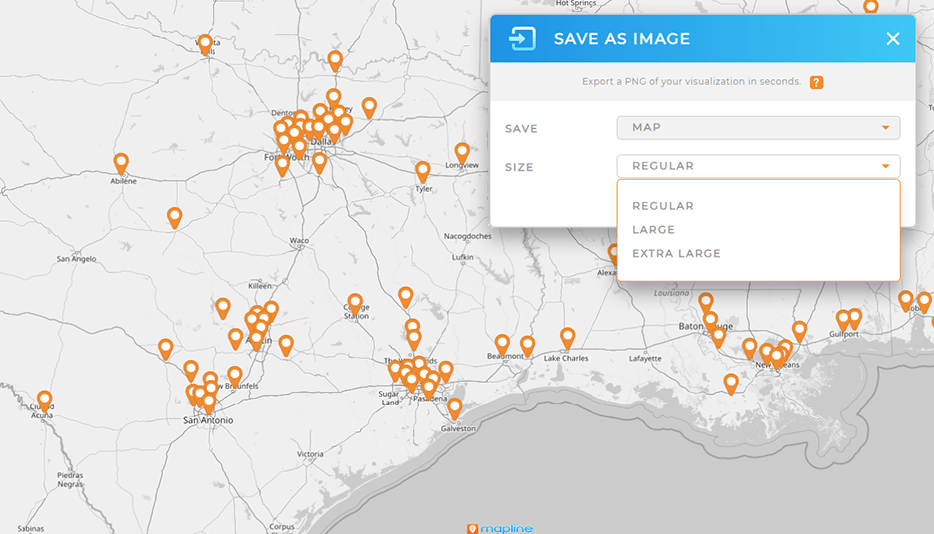
Mapline makes it simple to download a map image without compromising quality. The export process takes seconds and allows you to preserve the exact styling, zoom level, and map view you designed. Whether you’re exporting a PNG for a PowerPoint deck or a world map image for a report, the process is identical. Use this workflow anytime you need a ready-to-share map without additional formatting.
Step 1 — Finalize Your Map View
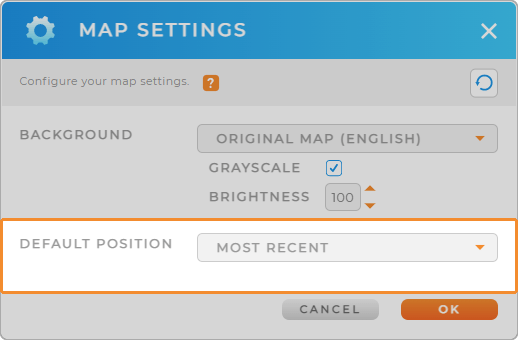
Adjust zoom level, filters, and pin styles before you export. The export tool captures exactly what is visible on your screen. Make sure you’ve turned on any labels, shapes, territories, or coverage circles so they appear in the final image. This step is helpful when you’re working on location-based storytelling or territory analysis.
Step 2 — Click “Export Image”
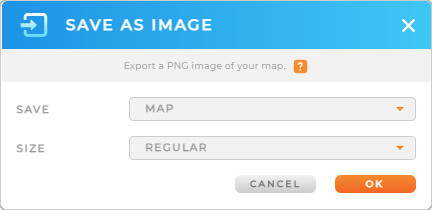
From the toolbar, select the option to export your map. Unlike screenshotting, exporting creates an optimized, presentation-ready file. Choosing PNG ensures a crisp result on both digital screens and printed materials. Mapline also lets you name your file so it’s easy to track alongside presentation assets.
Step 3 — Choose Image Format & Resolution
Mapline automatically generates a high-definition map image. PNG files preserve sharpness, color, and styling—ideal for slides and websites. Maps with pins, shapes, or heat maps maintain detail even when zoomed in for large screens or projection. Files are saved instantly to your device.

Step 4 — Add Image to Your Presentation or Report
Insert the exported PNG into PowerPoint, Keynote, or Google Slides. Because PNG is a high-resolution format, your map will not degrade when resized or stretched. You can also drag and drop the file into PDFs or dashboards without compression loss.

Best Practices for Adding Map Images to Slide Decks
Adding a map to a presentation is more than placing an image—it’s about guiding your audience through insights. The right formatting makes data easier to understand. Choose a clean slide layout with minimal text. Ensure that map labels and territories are readable at the distance your audience will view them. If you need to emphasize specific areas, use color-coded pins or boundary lines before exporting so your message is visually clear.
Use Contrast for Readability
Select color themes where the pins and shapes stand out against the base map style. Light pins on a dark map—or dark pins on a light map—help the audience quickly grasp your visual message.
Add Coverage Circles or Territories Before Exporting
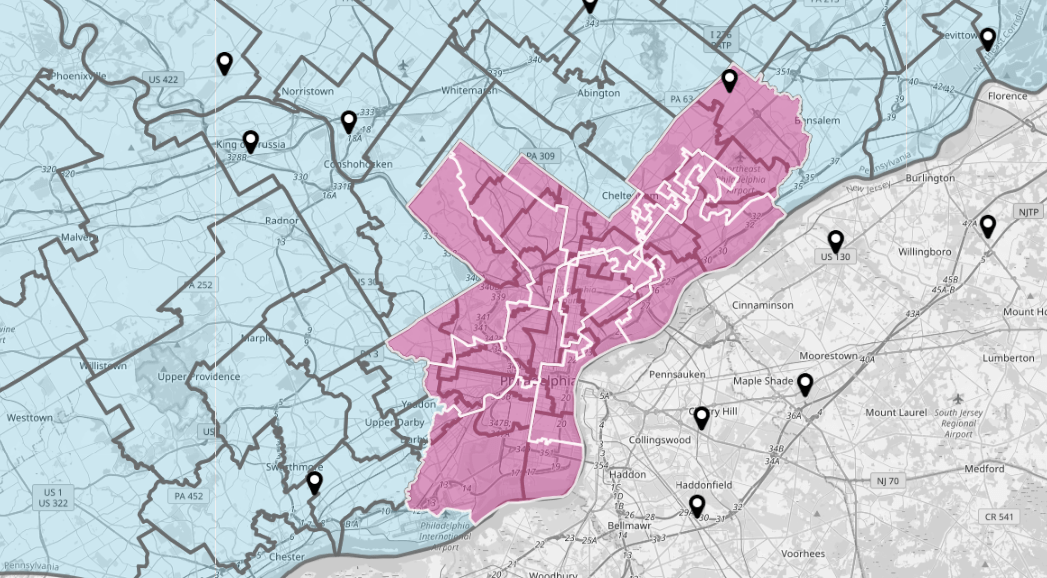
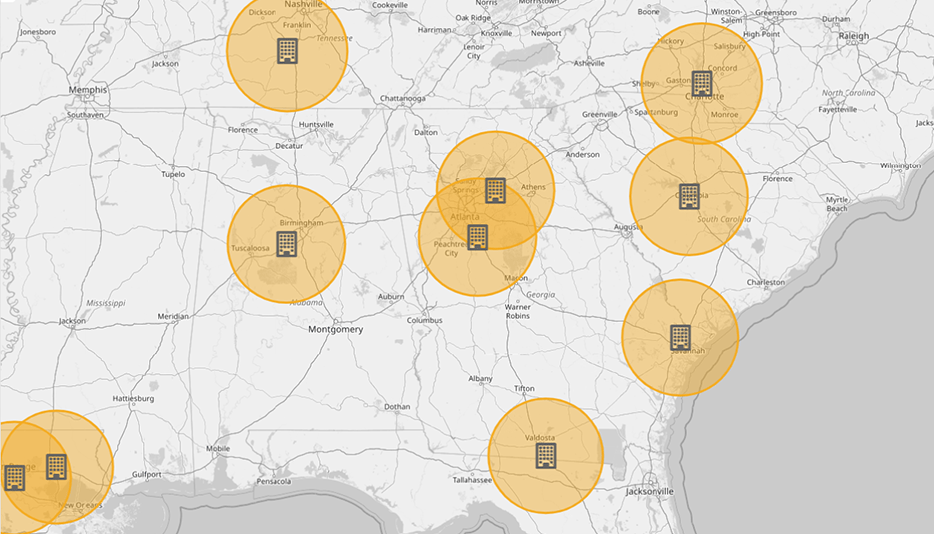
Territories, coverage circles, and regional boundaries turn your map into a visual story. They help your audience understand factors like delivery coverage, sales regions, or target markets without needing extra explanation.
Keep Labels Clean and Focused
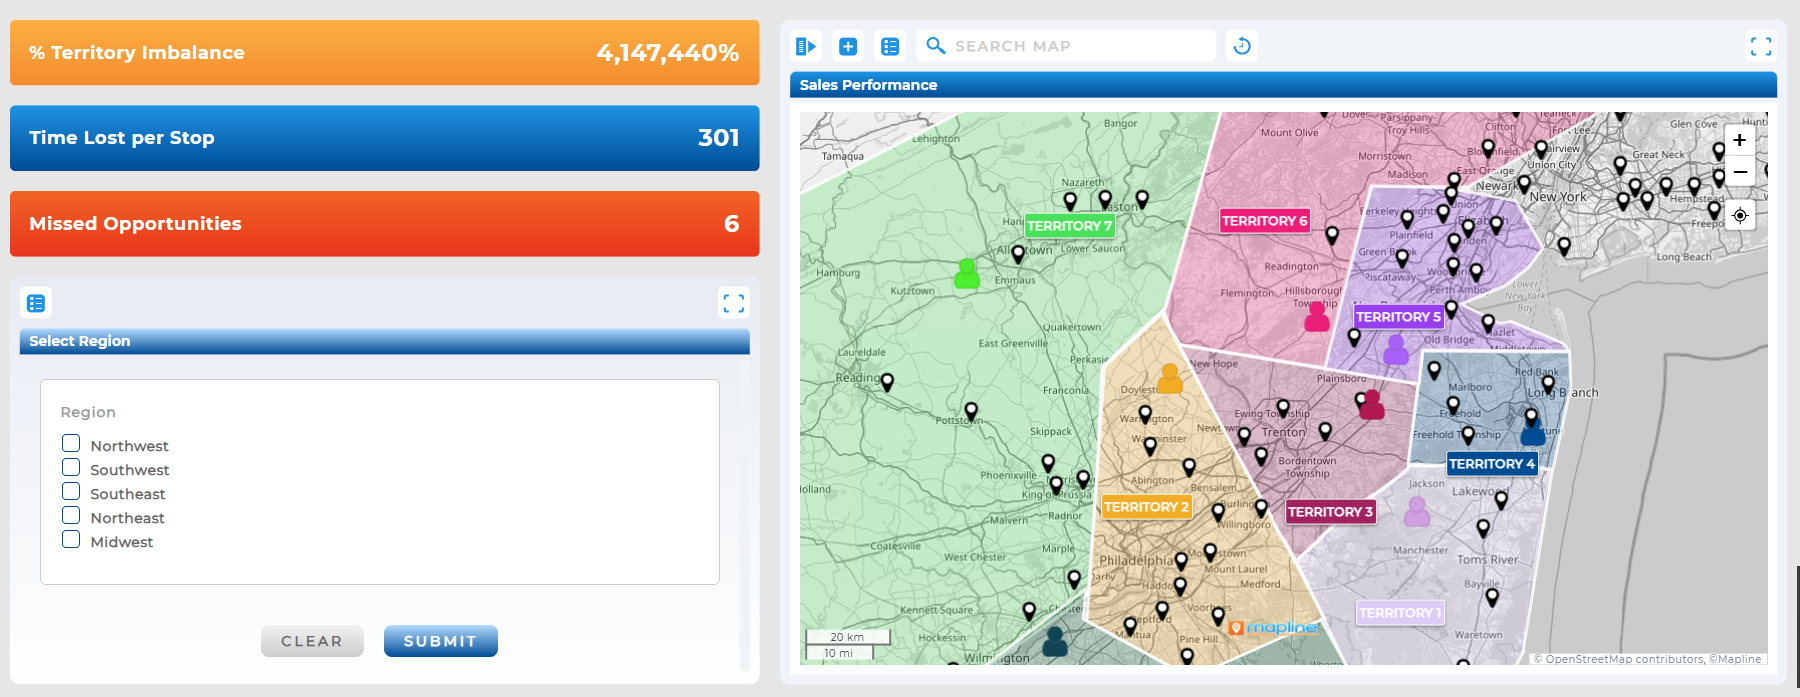
Turn on only the labels that matter for the story you’re telling. Too many labels create noise. Clear labeling keeps the focus on insights instead of the map itself.
How Map Exports Compare to Screenshots or Templates
Exported map images are cleaner, sharper, and more professional than screenshots. Screenshots compress image quality and require manual cropping. By exporting from Mapline, your presentation assets are automatically optimized for display and print. Even world map PNG exports retain clarity when scaled to full-slide width or printed for executive reports. This gives you consistent branding and a unified look for everything you produce.
Yes. Whatever is visible on your map when you export will appear in the final image.
Yes — PNG is the recommended format for slide decks and visual presentations.
Yes. Mapline also supports embed links if you want an interactive map on a webpage or dashboard.
Absolutely — satellite view exports in high definition and retains map detail.


