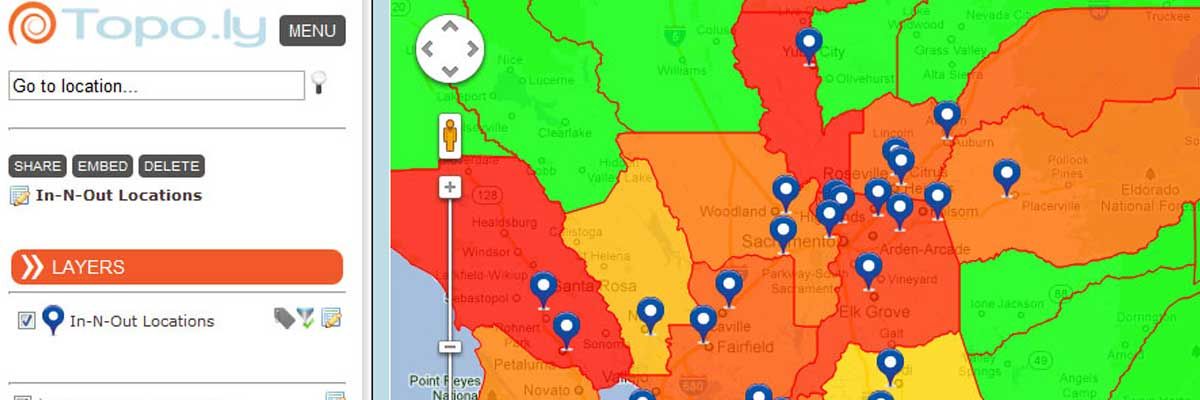
New Feature: Heat Mapping Excel Spreadsheet Data
Have you ever wanted to group your customers together and visualize the highest performing Zip Codes, Counties, or State Territories? Well, now Mapline empowers you to build heat maps of your data wi,,th a simple copy and paste from Excel! Use our heat mapping tool to inform you in identifying growth opportunities or help you know where to focus your marketing investments. Determine the best areas to allocate capital investments or determine high-performing territories. 

Heat Mapping In Your Business
It’s easy to build heat maps using any columns from your spreadsheet. For example, if you have a list of customers and their annual sales in your spreadsheet, then you can make a heat map three different ways:- Customer Density where each Zip Code (for example) will be colored according to the number of customers within that boundary
- Customer Total Sales where each Zip Code would be colored according to the total sales from all customers in the territory
- Customer Average Sales where each Zip Code would be colored by the average (per customer) sales


