- Blog
- Geo Mapping
- Static vs Dynamic Map Exports: When to Use Each
When preparing a map for a presentation, report, or dashboard, choosing the right type of map export—static or dynamic—controls how your audience interacts with the data. Static exports are image-based and perfect for polished, slide-ready visuals. Dynamic maps, on the other hand, pull live data and allow users to explore layers, pins, and metrics on demand. In this post, you’ll learn when to use static PNG exports and when a dynamic, interactive map provides more value to your audience—especially when internal teams need to drill deeper into routes, territories, or customer data.
Static Map Exports (PNG) — Crisp, Presentation-Ready Visuals
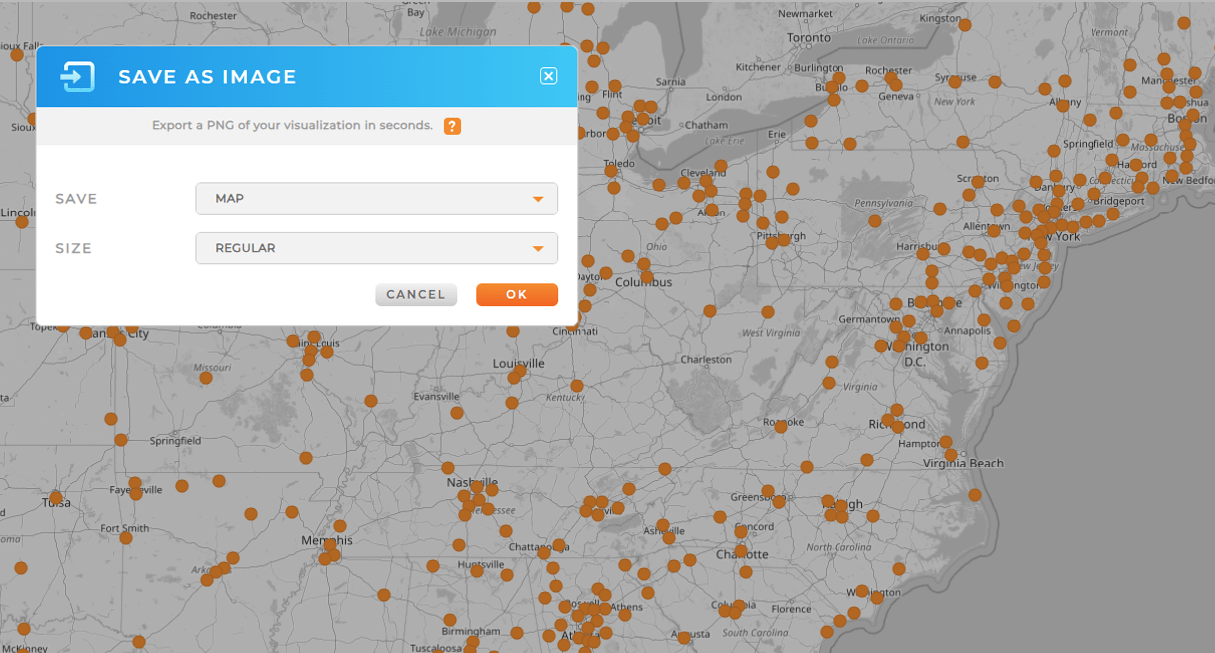
Static map exports are ideal when you need a fixed visual for slides, PDFs, printed materials, or executive presentations. A static map is essentially a high-resolution image; nothing updates or changes once exported. This makes static maps perfect for delivering a clear, story-driven visual without overwhelm or distraction. They’re compact, easy to share, and universally compatible with platforms like PowerPoint, Google Slides, and email attachments. Use static exports when you want full control over what the viewer sees and how they interpret data.


Pro Tip: Use a static export at the beginning of a presentation, and link a dynamic version in the follow-up email so stakeholders can explore the data themselves.
Best Use Cases for Static Maps
Static maps are the right choice when your audience doesn’t need to explore the map or interact with the data. They’re perfect for sales decks, stakeholder presentations, trade show slides, or print collateral. Exporting maps as PNG ensures high resolution for zooming and projecting onto large screens. Use static maps when the goal is clarity—not exploration.

Perfect for PowerPoint, PDF, and Print
Static map exports shine when the goal is consistency and visual impact. Because PNG files preserve sharp lines and color detail, your map remains crisp when resized on slides or printed on large-format displays. There’s no risk of accidental zooming, shifting views, or revealing confidential data through interaction—what you export is exactly what the audience sees. Static exports also simplify reviews because every stakeholder sees the same version of the map.

Dynamic Maps — Live, Interactive, and Data-Driven
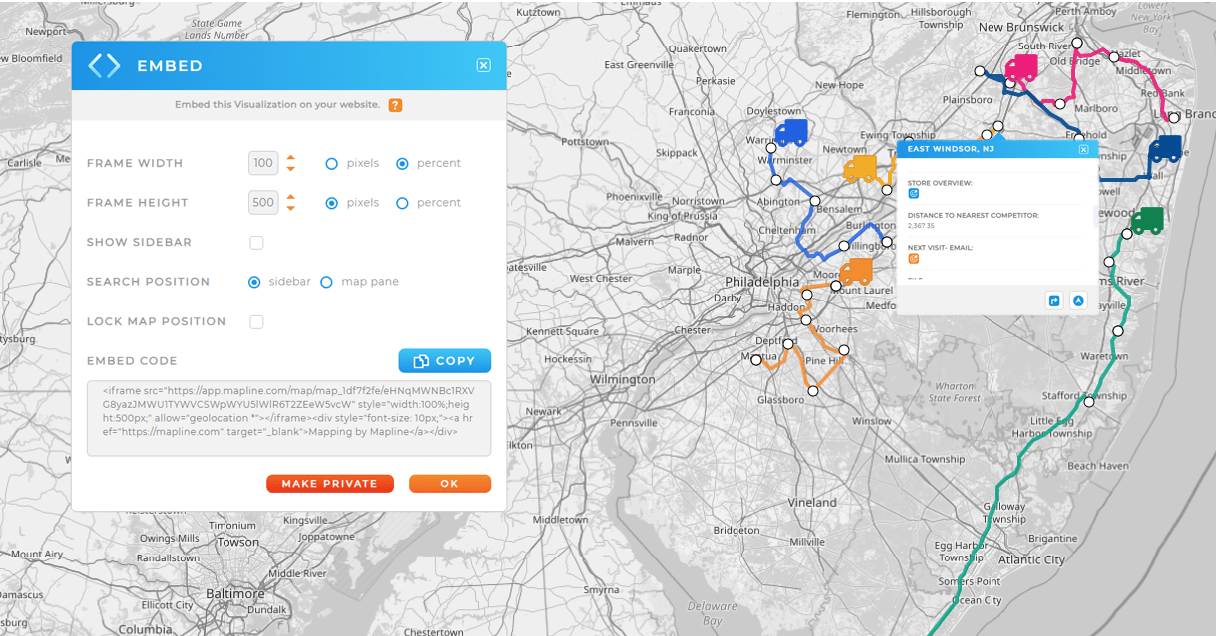
Dynamic maps are built to be explored. Instead of delivering a frozen visual, dynamic maps allow your audience to zoom, filter, hover over pins, toggle layers, or reveal real-time data on demand. They are particularly powerful when dealing with large datasets, evolving location data, or scenarios that require ongoing updates—such as delivery planning, field service scheduling, or territory management. Dynamic maps connect to your data source, meaning customers, technicians, or analysts always see the most current information. When the underlying data changes, the map changes automatically—no need to re-export.

Best Use Cases for Dynamic Maps
Use dynamic maps when viewers need to interact with your data or explore deep detail. They’re ideal for dashboards, embedded analytics on your website, or collaborative planning sessions with cross-functional teams. For example, a dynamic routing map allows dispatchers to reroute drivers, update priority stops, and track progress in real time. In dashboard views, users can filter territories, click pins to expand details, or visualize customer distribution. Dynamic maps are the right choice when maintaining data accuracy and flexibility is critical.

Ideal for Dashboards, Live Data, and Collaboration
Dynamic maps transform static visuals into interactive decision tools. Users can hover to see location details, switch between data layers, or change filters in real time. When working with large datasets—such as thousands of customers, delivery stops, or field assets—dynamic maps eliminate the need to generate new exports for every view. Instead, teams get a living map that updates itself based on your data source, which means no repetitive downloads or manual file management.

Static vs. Dynamic Maps: Key Differences
While both static and dynamic maps communicate location-based insights, they serve different purposes depending on your output: storytelling or exploration. The table below highlights the main differences and how each map type supports your workflow. Static maps bring visual clarity and simplicity, while dynamic maps unlock deeper analysis and live collaboration.
| Feature | Static Map Export (PNG) | Dynamic Map (Interactive) |
|---|---|---|
| Updates Automatically | ✖ No — image is fixed once exported | ✔ Yes — reflects live data |
| Interactive (zoom, click, filter) | ✖ Not interactive | ✔ Fully interactive |
| Best For | Presentations, PDFs, print | Dashboards, collaboration, live updates |
| Visual Consistency | ✔ Always looks the same | Depends on viewer settings |
When to Use Static vs. Dynamic in Mapline
Mapline offers both static exports and dynamic map sharing—so you don’t have to choose one or the other. Presenters can export high-resolution PNG maps for slide decks, while analysts can share a dynamic map link for deeper exploration. This flexibility makes Mapline ideal for teams that collaborate across business functions—sales, operations, planning, and leadership. Whether you’re showing results or exploring decisions, Mapline adapts to your workflow.
Yes, Mapline exports crisp, presentation-ready PNG images without pixelation.
Yes — you can share a view-only link or embed the interactive map into dashboards.
Yes — any visible layers will appear in both static and dynamic versions.
Yes, but you may encounter resolution limits depending on the platform. Mapline exports at full resolution every time.


