
How Mapping Cercles of Mali is Used for Problem Diagnosis
Use a Map of Mali Cercles for Practical Applications
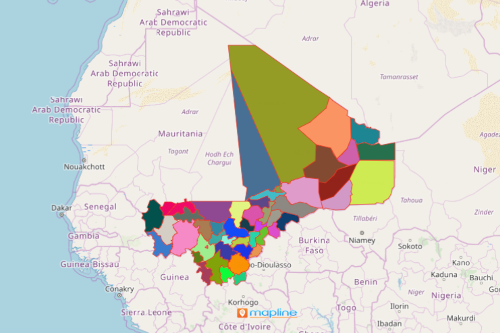
By mapping cercles of Mali, organizations enjoy a one-of-a-kind visual experience that shows relationships between locations. Mali is a country located in West Africa. Since 2016, the country has been divided into 10 regions, 56 cercles, and 703 communes. Currently, Mali relies on cotton production as its key economic factor.
A territory map of cercle boundaries is a powerful data visualization. Thus, thought leaders use and depend on it for insights on their decision making. The insights are derived from the connections built between data layers and territory boundaries. Mapping location data provides a clearer picture of what is actually happening on each cercle. In addition, users rely on territory maps for problem diagnosis. It is used in different practical applications be it in business, community service, health, medicine, marketing, and so much more!
Map and Embed in a Minute!
Create a map of Mali Cercles in a snap! Once the map is generated, easily embed it on a website. Here’s how to get started:
- Create a Mapline account and login.
- Click the orange “Add New Items” button.
- Select “New Map” on the drop down arrow.
- Give your map a name and click “OK.”
- Click the “Add” button from the left sidebar.
- Select the “Territories” option.
- Click “From Mapline’s Repository.”
- From the “Territories” select “Mali Cercles.” You can also enter that on the search bar.
- Select how you want your boundaries to be colored in “Fill Color” (Random Colors, Uniform Color, Dynamic heat map colors, or Custom colors from spreadsheet).
- Click “OK.”
Sign up now to know to get better acquainted with other powerful mapping tools. Mapline continues to develop mpping functionalities for problem diagnosis.