
How The Gambia Region Map is Used to Analyze the Economic Impact of Crisis
Mapping the Gambia Regions for Detailed Understanding and Managing Crises
The Gambia region map is pertinent when it comes to analyzing the impact of a crisis on trade industry. Yes, we all know that The Gambia is all about beautiful, uncrowded beaches, year-round sunshine, and breathtaking tourist spots. However, it doesn’t mean that it is exempted to crises. For one, there is the pandemic which affected almost all parts of the earth. Still, managing crises is the priority of the government. Trade is an important factor in The Gambia’s economy. From it, the country thrives in generating income and creating job opportunities. A map with region boundaries of The Gambia makes it more possible for local government agencies to draw a strategic approach to protect the country against any harm that crises may bring.
Mapping tools such as overlaying boundaries, adding locations data, and heat mapping, are some of the most powerful tools to help analyze and manage the crises across all regional boundaries. A heat map identifies regions that are most affected by the crisis compare to others. Viewing the density of the areas spark ideas on how other regions can be of help.
Mapping to Understand the Trade Sector
To understand fully how the trade sector has been impacted by crises like the pandemic, it is best to create a region-boundary map of The Gambia. Try collecting different layers of data to learn more about the impact of a crisis on trading. For example, add data on imports, local exports, and agriculture. Then, add annual sales data, comparisons, etc. With a clear visualization, data analyses will drive better judgment on decision-making.
Here are the easy steps to follow to create The Gambia region map:
- Create a Mapline account and login.
- Click the orange “Add New Items” button.
- Select “New Map” on the drop down arrow.
- Give your map a name and click “OK.”
- Click the “Add” button from the left sidebar.
- Select the “Territories” option.
- Click “From Mapline’s Repository.”
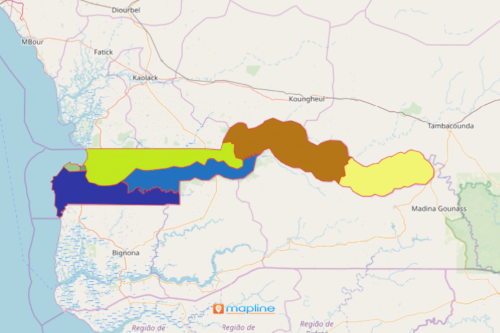
- From the “Territories” select “The Gambia Regions.” Use the search bar for quicker results.
- Select how you want your boundaries to be colored in “Fill Color” (Random Colors, Uniform Color, Dynamic heat map colors, or Custom colors from spreadsheet).
- Click “OK.”
Need more help on analyzing data? Sign up now and discover a lot more powerful mapping tools to extract insights from your data!