
Hungary County Map to Monitor Asset Location
Use County Mapping for Asset Tracking
Asset managers rely on a Hungary county map to keep track of their company assets. Their roles involve looking for resources, maximizing performances, minimizing costs, and mitigating risks. What better way to help them effectively shoulder these roles is by adding their data on a map. Mapping their Excel location data on a territory map further helps in visualizing the answers to where, what, why, and how. In an instant, connections and patterns will start to appear. Learning from these connections result in actionable insights to help companies manage their assets.
With its powerful mapping tools, Mapline makes it so much simpler for asset managers to look at the areas on a different level. These tools can be used to share status updates of the assets. In addition, mapping tools are used to manage risks and improve customer satisfaction.
The Better Role of County-Level Mapping
A county map shows a holistic view of your company’s assets. Build a map in a few seconds and start your data analysis right away!
- Create a Mapline account and login.
- Click the orange “Add New Items” button.
- Select “New Map” on the drop down arrow.
- Give your map a name and click “OK.”
- Click the “Add” button from the left sidebar.
- Select the “Territories” option.
- Click “From Mapline’s Repository.”
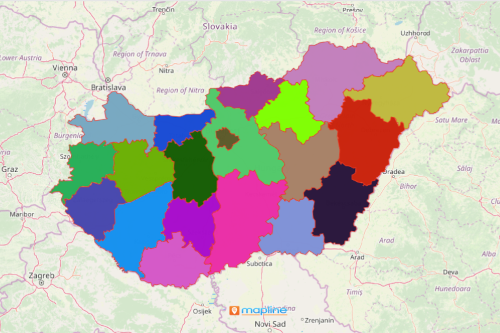
- From the “Territories” select “Hungary Counties.” You can also enter that on the search bar.
- Select how you want your boundaries to be colored in “Fill Color” (Random Colors, Uniform Color, Dynamic heat map colors, or Custom colors from spreadsheet).
- Click “OK.”
Indeed, maps with territory boundaries empower the asset managers to see what really goes on and what lies ahead. Sign up now and take advantage of the best mapping tools for asset management and analysis.