MARSHALL ISLANDS AND ATOLLS
- Territory Guide
- MARSHALL ISLANDS AND ATOLLS
Add the Marshall Islands and its atolls to your map to assess how these boundaries impact your business growth! Gain valuable insights into regional trends, customer distribution patterns, and factors affecting sales. Harness your insights to unlock fresh perspectives on your operations and market. Because of its granularity, this approach can elevate your geospatial analysis!
Here’s how to quickly add these administrative divisions to your map, unlocking a world of potential for your business.
WHAT ARE MARSHALL ISLANDS AND ATOLLS?
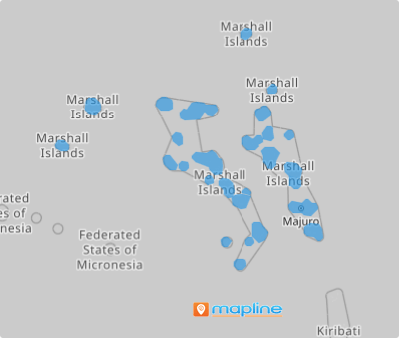
The Marshall Islands, a nation of 29 coral atolls and 5 standalone coral islands, forms two distinctive island chains that run parallel from northwest to southeast. The eastern Ratak chain, meaning “Sunrise,” and the western Rālik chain, meaning “Sunset,” define the unique layout of these islands. Located in the Micronesian region of the Pacific, halfway between Hawaiʻi and Australia, the Marshall Islands serve as a remarkable crossroads.
An atoll itself is a fascinating type of island, formed when a coral reef develops around a sinking volcanic island. As the volcanic island gradually erodes and sinks beneath the waves, the resilient coral reef continues to grow, eventually creating a ring-like structure dotted with small islands encircling a central lagoon—a natural wonder shaped like a doughnut.
Unlock valuable insights by mapping the boundaries of the Marshall Islands atolls. This in-depth analysis creates a detailed blueprint of the nation’s varied market landscape, revealing areas with growth potential and providing a strategic edge. With this comprehensive view, you can position your business to thrive in the unique economic environment of the Marshall Islands.
ADD MARSHALL ISLANDS AND ATOLLS
Discover the strategic advantage of incorporating a map of the Marshall Islands and its atolls into your business toolkit. By overlaying detailed atoll-level data on your maps, you can enhance your market insights and operational efficiency. This powerful visualization enables you to identify trends, optimize resource allocation, and make informed decisions that drive your business forward!
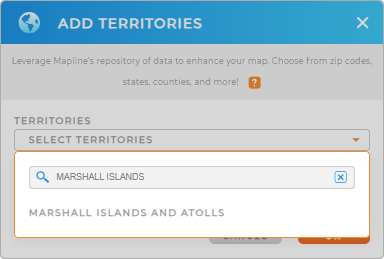
Quickly add a new territory from Mapline’s repository by typing MARSHALL in the search bar to click and add MARSHALL ISLANDS AND ATOLLS.
One important step left, and you’ll be analyzing this territory map in seconds!


Pro Tip: Unlock the potential of Mapline’s global territory repository to elevate your spatial analysis capabilities! Seamlessly add Marshall Islands and atolls to your map to help you tap into powerful territory insights.
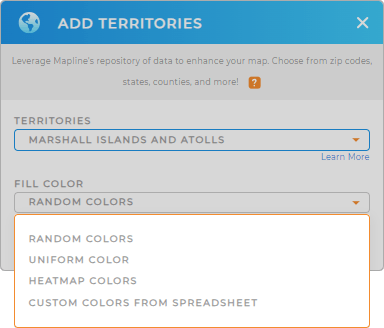
CHOOSE ISLAND AND ATOLL COLORS
By splashing in some colors, you enhance your data visualization and analytics. Static colors help to easily identify distinctions between boundaries. Dynamic colors help to quickly hone in on performance metrics, demographic trends, and operational efficiencies at a glance. They help interpret complex data, driving smarter decision-making and strategic planning for your business.
Whatever color styles you choose, you’re a winner in Mapline as you gain deep insights for informed decisions that drive overall business success.

GET NEW TERRITORY INSIGHTS
But don’t just stop there. There are a lot more powerful capabilities that you can utilize to enhance your data analytics. Let’s explore some of them:
- Compare and contrast historical data to reveal new insights about your sales, operations, and customers
- Compare competitor locations with Mapline Data
- Generate reports in a flash


