
Add Location Data on a US Block Map
Block-Level Mapping by County
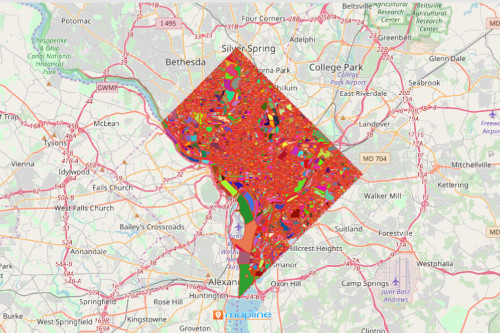
It is now possible to create a US block map per county! Now, Mapline makes it easy for you to represent your location data on a block-level mapping. A block is the smallest geographic unit where the Census Bureau tabulates decennial census data. It is bounded by both visible and non-visible boundaries. For visible features there are roads, railroad tracks, streams, and streets. For non-visible, there are county boundaries, selected property lines and city, school district, and townships.
Another good thing about letting Mapline assist you with data analyses is that in only just a few seconds, you can get population data based on criteria set for specific analysis. Mapline provides US demographic data wherein you can easily access household information, income, and population which you can overlay to your territory map.
Map US Blocks to Show How Locations Really Matter
A block-level map takes only a few seconds to create. The block boundaries are available per county per state. So start mapping now!
- Create a Mapline account and login.
- Click the orange “Add New Items” button.
- Select “New Map” on the drop down arrow.
- Give your map a name and click “OK.”
- Click the “Add” button from the left sidebar.
- Select the “Territories” option.
- Click “From Mapline’s Repository.”
- From the “Territories” select “U.S. Blocks.” You can also enter that on the search bar.
- Select how you want your boundaries to be colored in “Fill Color” (Random Colors, Uniform Color, Dynamic heat map colors, or Custom colors from spreadsheet).
- Click “OK.”
Sign up now to get more ideas on what else you can do beyond creating a US Block map.