
Transform Location Data into Action by Using a US Military Installation Map
How Mapping Military Installation Boundaries can be Used in Spatial Analysis
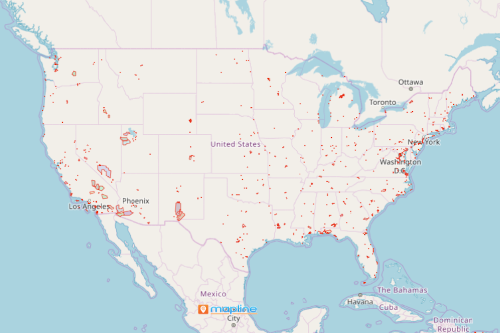
The US military installation map not only shows the military bases in the country. When Excel locations data is added, the map can transform data into actionable information. With an overlay of territory boundaries, a map is a very powerful data visualization that allows you to understand the relationships between locations. In fact, it provides answers to spatial questions that require a deeper understanding of geographical boundaries as well as the connections between locations.
If you apply some other mapping tools such as distance measurement, you can determine how two locations are related. Measuring and analyzing distances between all your locations takes only a few clicks. When this tool is applied, you are able to visualize how the locations may be nearby, or accessible. Additionally, you are able to gain insights that are valuable for decision-making on how to improve transportation routes, optimize supply chain, and expansion.
Generate a US Military Installation Map Under a Minute
Here’s the quick step-by-step to follow:
- Create a Mapline account and login.
- Click the orange “Add New Items” button.
- Select “New Map” on the drop down arrow.
- Give your map a name and click “OK.”
- Click the “Add” button from the left sidebar.
- Select the “Territories” option.
- Click “From Mapline’s Repository.”
- From the “Territories” select “U.S. Military Installations (2018).” You can also enter that on the search bar.
- Select how you want your boundaries to be colored in “Fill Color” (Random Colors, Uniform Color, Dynamic heat map colors, or Custom colors from spreadsheet).
- Click “OK.”
Sign up now and start to expand more on your data analyses. Mapline has a lot of mapping tools to offer to help you see a heap of wealthy variables behind each location.