How-To Guide
Segment Charts
- How-To Guide
- Segment Charts
Elevate your chart superpowers with advanced segmentation! By splitting your chart data into categories, you can uncover even deeper insights that would otherwise be hidden. This is more than just organizing your data—it’s about getting a clearer, more focused view of what’s really going on. Whether you’re analyzing customer behavior, spotting factors impacting sales, or pinpointing errors affecting fulfillment, segmentation helps you make sense of complex data in seconds.
Advanced segmentation gives you the ability to zoom in on specific trends and patterns that can drive your next business move. It’s a powerful way to fine-tune your strategy and take targeted action. Let’s dive in and learn how to segment your charts in seconds, so you can unlock more insights, make smarter decisions, and move with speed and precision!
SEGMENT Y-AXIS FIELDS
Maybe you want to see sales for each of your stores, split out by sales rep.
Or maybe you need to see technician compliance, segmented by zip code.
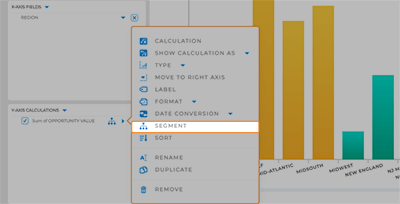
Just click the SEGMENT icon that appears next to the Y-Axis field you’d like to customize. (Or, click the hamburger menu and SELECT segments from the pop-out menu).
Next, apply your segment logic, and BAM! The info you need is right there in your chart.
How easy was that?

PRO TIP: Segment multiple Y-Axis fields for even more detail. Now that’s useful!
PUT YOUR CHART TO WORK
Now that you know how to segment your charts, let’s explore how you can apply this powerful tool to real-world business scenarios. By using segmentation, you can quickly analyze and respond to key insights that can improve operations, drive sales, and enhance customer experiences.
- Track Sales Performance by Region: Segment your sales data by region to identify which areas are performing best and which need more attention or resources
- Analyze Customer Behavior: Group customer data by demographics or purchase history to uncover trends, tailor marketing efforts, and predict future buying patterns
- Optimize Inventory Management: Segment your product sales by category to determine which items are in high demand and which are underperforming, helping you adjust stock levels accordingly
- Monitor Service Performance: Break down service data by technician or team to evaluate performance, identify bottlenecks, and ensure a smooth customer experience


