MAPLINE
JANUARY 2022
UPDATES
MAPLINE
JANUARY 2022
UPDATES
You asked, we answered! Mapline offers the most powerful data visualization solutions available in today’s world. That’s why, when we heard the features and updates you requested, we knew we had to implement your ideas right away.
We’re thrilled that you came to us with these suggestions so we can continue making Mapline the most useful, intuitive data visualization tool on the internet.
Performance Improvements
Customers love our segments because they can help to visualize geographic groups based on different criteria. However, it can sometimes take a while to load so much data. This is why we’ve been working hard to improve Segments speed.Now Segments load 50% faster!
We’re excited to help you save even more time and crush your goals.

2020 U.S. Zip Codes Available in Mapline
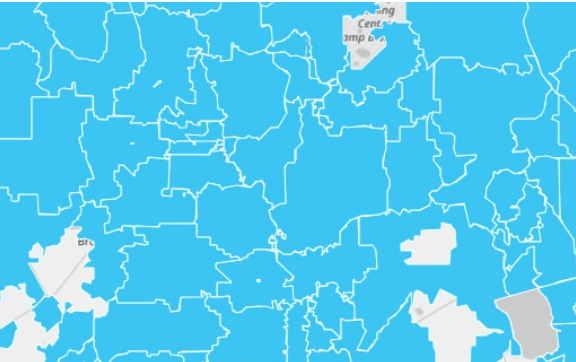
We’re elated to announce that 2020 U.S. zip code boundaries are available in Mapline! These are the most up-to-date zip codes available from Uncle Sam, and now you have them right at your fingertips.
Add the most recent zip code territories to your maps to unlock even more helpful insights.

Dynamic Territory Styling Updates
If you’ve been using dynamic territory styling, this is for you!
New dynamic styling options give you more control over the colors and gradients on your territory heat map.
Additionally, assign specific HTML colors or hex codes to display territories exactly the way you want.

Break Out Demographics by Ethnicity
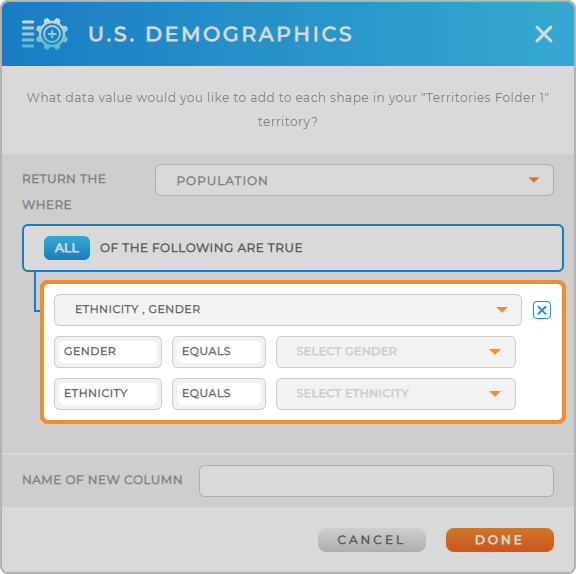
Take advantage of even better demographic analysis with our new filter that breaks population out by ethnicity.
How are you using demographic data in Mapline? If there are other features you’d like to see, please feel let us know!

New Shortcuts!
New shortcuts are available in filters and charts.
Save yourself time by adding new dynamic data columns directly from your charts!
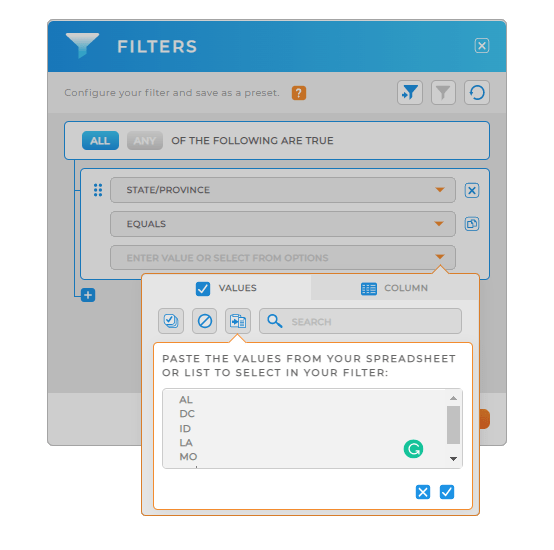
Plus, check out the new ‘Copy & Paste’ button in filters. Instead of manually selecting criteria from the drop-down menu, just copy and paste values right from your spreadsheet.


