Summer is here, and we’re heating things up with a sizzling array of updates to take your maps and workflows to the next level. Get ready to dive into a pool of exciting new features designed to supercharge your workflows and unlock fresh insights.
Whether you’re planning routes for summer deliveries, optimizing sales territories for peak season, or analyzing marketing data for your next campaign, our May updates will make things run smoother than ever. So grab your sunglasses and a cold drink, because it’s time to soak up the sun and explore the hottest enhancements in town!
FORM UPDATES
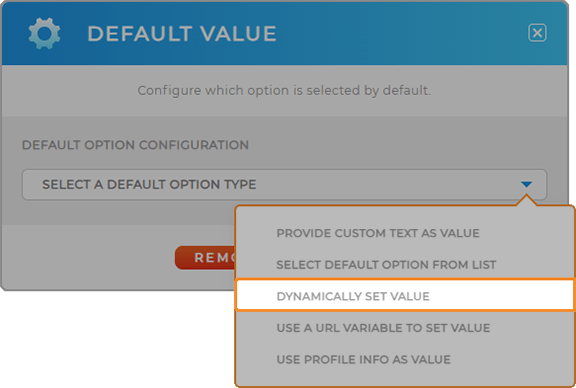
In May 2023, we introduced default values for form answers, and now we’re taking it a step further.
Now, you can add dynamic default values to your forms, giving you the power to auto-populate user-specific text.
Isn’t that incredible?
What a powerful way to enhance user experience and data accuracy. For example, field service technicians can streamline reporting by automating default text responses based on the service location or type of service requested, ensuring consistency and efficiency across the board.
MAP UPGRADES
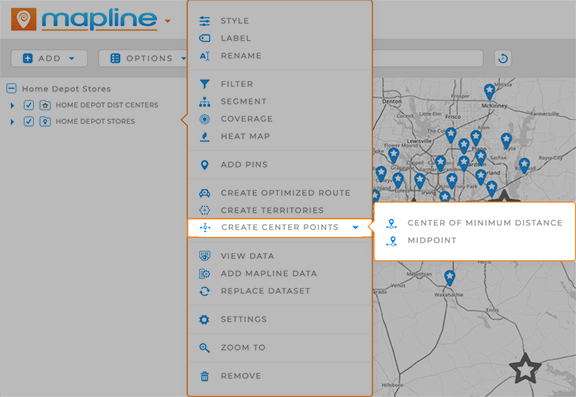
Level up your mapping game by generating center points from your existing map pins!
This is a powerful way to visualize the following center points between pins:
- CENTER OF MINIMUM DISTANCE: The point of absolute minimum travel distance
- MIDPOINT: The exact middle point between map pins or locations
This is a fantastic way to add unparalleled precision to your analyses.
Additionally, we’ve renamed the territory menu item from REPORT to VIEW INTERIOR DATA for clarity. This name change offers a more accurate representation of the nature of this report, which contains only data from the individual territory you click on.
DATASET ENHANCEMENTS
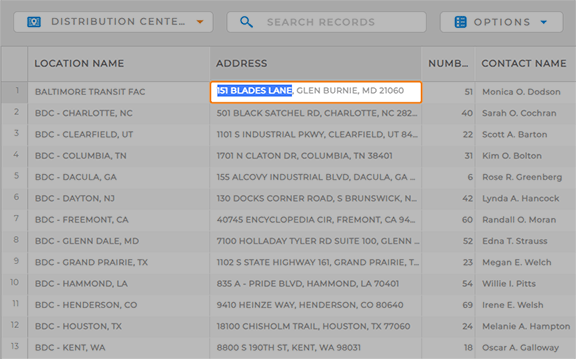
Now you can select partial text from read-only datasets or views, giving you the flexibility to utilize data more effectively. Easily copy essential information like addresses or sales totals, streamlining workflows and providing quick access to crucial data.
VISUALIZATION UPDATES
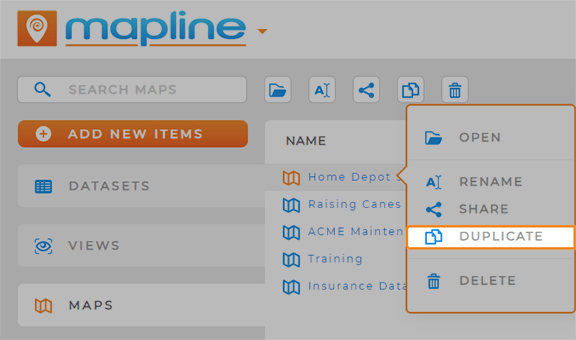
Effortlessly duplicate any dashboard, visualization, or form, saving time and effort when creating new items.
For example, marketing teams can duplicate successful campaign dashboards, making minor adjustments for new campaigns while retaining the same structure and metrics for efficient analysis.
Plus, easily run calculations directly in the Y-Axis field of any chart and report. This makes it even easier to unveil deeper insights on the spot!
MAPLINE DATA ENHANCEMENTS
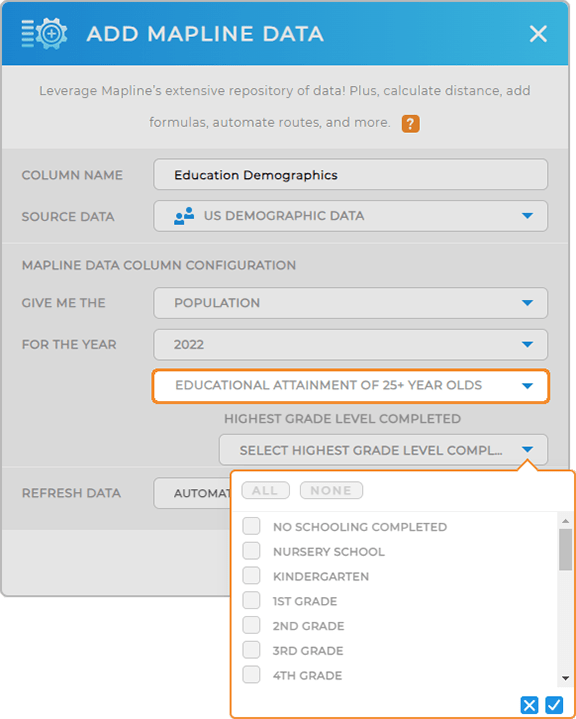
Expand your demographic insights by adding education demographics to your maps and datasets. Analyze education attainment levels (from high school diplomas to PhD degrees) to tailor marketing campaigns and target specific demographics more effectively.
For instance, you could target areas with higher concentrations of college-educated individuals for specialized messaging and product offerings.
