CHILE PROVINCES
- Territory Guide
- CHILE PROVINCES
Mapping Chile provinces can transform your brand’s analytics and optimize operations. With a detailed view of provincial boundaries, businesses can better understand regional dynamics, target specific customer segments, and streamline logistics. For example, identifying high-performing areas can help allocate resources more effectively, while understanding local demographics can enhance targeted marketing campaigns.
By leveraging this kind of granular regional view, you can uncover hidden patterns and insights that drive smarter decision-making. These maps are invaluable for strategic planning, allowing you to visualize your market and operations in a new light. Dive into the power of provincial insights and take your strategic planning to the next level! Let’s learn how to unlock the full potential of your business data a map of Chile provinces now.
WHAT ARE CHILE PROVINCES?
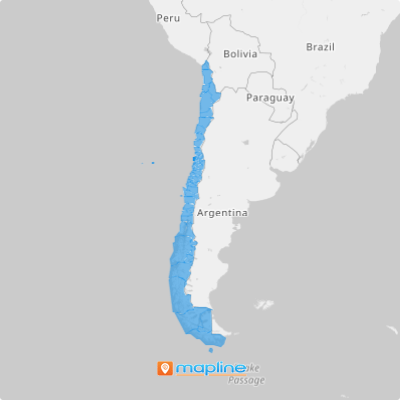
Chile is divided into 54 provinces, which are the second-level administrative divisions in the country, governed by provincial governors. Using a map of Chile’s provinces, you can identify key markets, optimize delivery routes, and enhance service coverage. This granularity in mapping can significantly impact decision-making processes across various business functions.
Picture this: effortless operations, unstoppable momentum, and a competitive edge that keeps you miles ahead. With Mapline, you’re not just mapping Chile—you’re unlocking its full potential, seizing opportunities, and rewriting the rules of success!
ADD PROVINCES TO MAP
Incorporating province boundaries into your map isn’t just smart—it’s a game-changer. Watch complexity transform into clarity as you reveal hidden patterns, pinpoint crucial resource gaps, and fine-tune operations with precision.
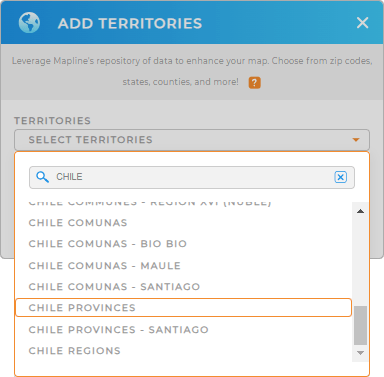
Integrate Chile provinces into your Mapline maps in a flash! First, add a new territory from Mapline’s repository and type CHILE into the search bar. Then, select CHILE PROVINCES.
You’re almost ready to capture instant insights with provincial boundaries plotted on your map! There’s just one more important step.


Pro Tip: Mapline offers an extensive repository of worldwide territory boundaries. Check out other administrative boundaries in Chile, like Chile regions or Chile communes, and harness new ways to strategize and succeed.
CHOOSE PROVINCE COLORS
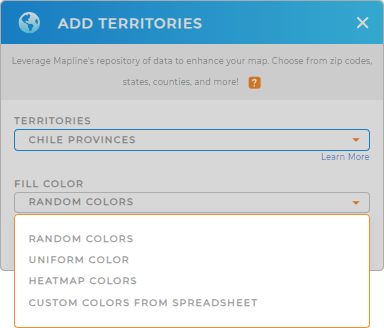
Using distinct colors for each province on your map enhances business analytics and operational efficiency. Color-coded provinces enable quick identification of key data points and trends at a glance.
Simply select your desired type of color styling, then click OK.
There’s no better way to visualize trends and variables that impact your business operations.

GET NEW TERRITORY INSIGHTS
But it doesn’t stop there! Here are some powerful ways to unleash the full potential of your map and gain deeper insights:
- Visualize data density and trends across different provinces to identify high-performing areas and potential opportunities
- Tailor your marketing campaigns by segmenting your audience based on provincial demographics and behaviors
- Embed your Mapline maps on a webpage to create store locators and empower customers to find the information they need


